Residue Plot
[1]:
from smpl import plot
from smpl import io
from smpl import functions as f
import numpy as np
import uncertainties.unumpy as unp
import matplotlib.pyplot as plt
You are using an unreleased version.
[2]:
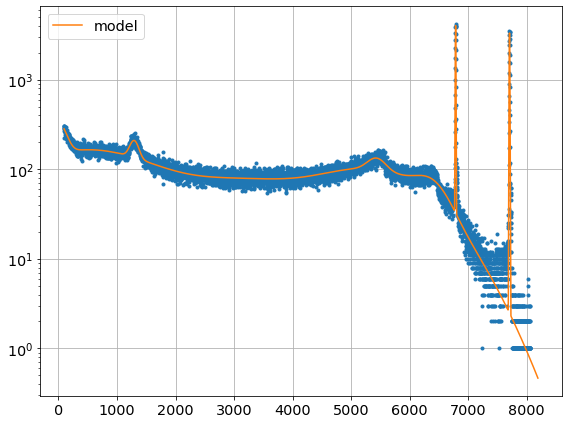
dat = np.loadtxt(io.find_file("dat.dat",3), skiprows=0, delimiter=" ")


xdata = dat[:,0]
ydata = dat[:,1]
ymodel = dat[:,-2]
[3]:
plot.data(xdata,ydata,logy=True,ss=False)
plot.data(xdata,ymodel,fmt="-",logy=True,init=False,label="model")
[ ]:
[4]:
data = np.loadtxt(io.find_file('test_linear_data.txt',3))
xdata = data[:,0]
xerr = data[:,2]
ydata = data[:,1]
yerr = data[:,3]
x = unp.uarray(xdata,xerr)
y = unp.uarray(ydata,yerr)
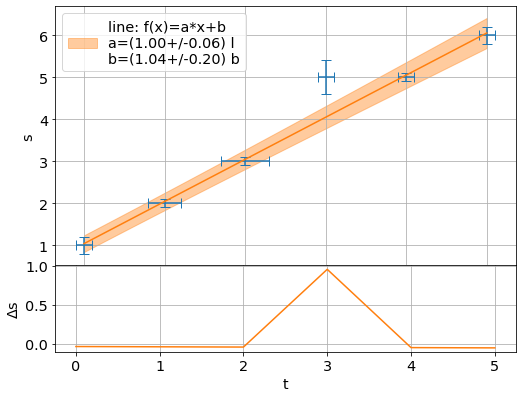
[5]:
plot.fit(x,y,function=f.line,residue=True,xaxis="t",yaxis="s",units=["l","b"],sigmas=1)
/home/apn/.local/lib/python3.7/site-packages/smpl-0.0.21.0+dirty-py3.7.egg/smpl/plot/plot.py:223: UserWarning: This figure includes Axes that are not compatible with tight_layout, so results might be incorrect.
  plt.tight_layout()
[5]:
array([1.0034626572607985+/-0.05947578069703216,
       1.0370200979931061+/-0.19838016816365187], dtype=object)
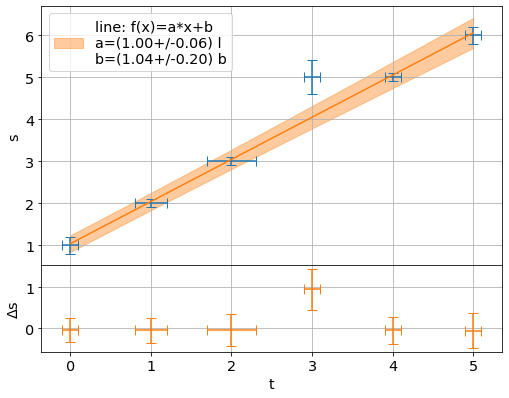
[6]:
plot.fit(x,y,function=f.line,residue=True,xaxis="t",yaxis="s",units=["l","b"],sigmas=1,residue_err=False)
/home/apn/.local/lib/python3.7/site-packages/smpl-0.0.21.0+dirty-py3.7.egg/smpl/plot/plot.py:223: UserWarning: This figure includes Axes that are not compatible with tight_layout, so results might be incorrect.
  plt.tight_layout()
/home/apn/.local/lib/python3.7/site-packages/smpl-0.0.21.0+dirty-py3.7.egg/smpl/plot/plot.py:223: UserWarning: This figure includes Axes that are not compatible with tight_layout, so results might be incorrect.
  plt.tight_layout()
[6]:
array([1.0034626572607985+/-0.05947578069703216,
       1.0370200979931061+/-0.19838016816365187], dtype=object)