Interpolate
Interpolate 1d
[1]:
from smpl import plot
from smpl import stat
from smpl import data
from smpl import interpolate
import numpy as np

from smpl import interpolate as interp
from uncertainties import unumpy as unp
[2]:
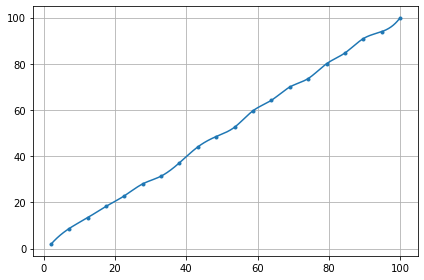
x = np.linspace(2,100,20)
y = stat.noisy(x)
plot.data(x,y,interpolate=True)
plot.show()
plot.data(x,y,interpolate=True,also_data=False)
plot.show()

[3]:
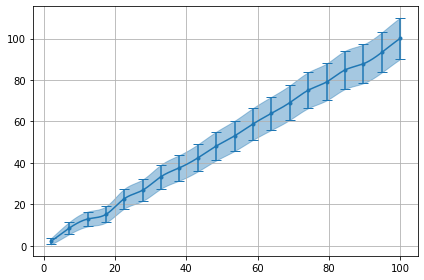
x = np.linspace(2,100,20)
y = stat.poisson_dist(stat.noisy(x))
plot.data(x,y,interpolate=True,sigmas=1,show=True)
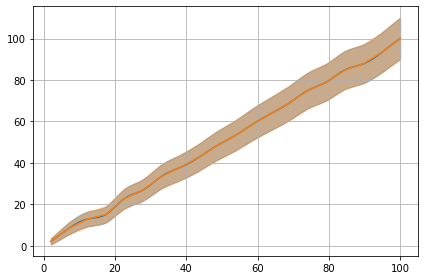
plot.data(x,y,interpolate=True,sigmas=1,also_data=False)
plot.data(x,y,interpolate=True,sigmas=1,also_data=False,init=False,interpolator='linear')
""
[3]:
''
[4]:
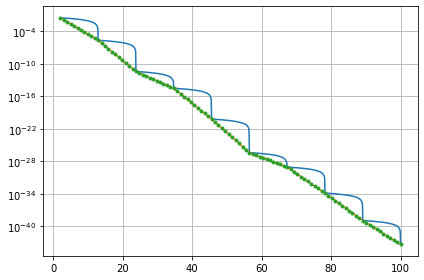
x = np.linspace(2,100,10)
y = np.exp(-stat.noisy(x,std=2))
plot.data(x,y,interpolate=True,also_data=False,interpolator='linear',logy=True)
plot.data(x,y,interpolate=True,also_data=False,interpolator='exp',logy=True,init=False)


f1 = interp.interpolate(x,y,interpolator="exp")

f2 = lambda x_ : np.exp(interp.interpolate(x,unp.log(y),interpolator="linear")(x_))
x2 = np.linspace(2,100,100)
plot.data(x2,f2(x2),logy=True,init=False)
plot.show()
Interpolate 2d
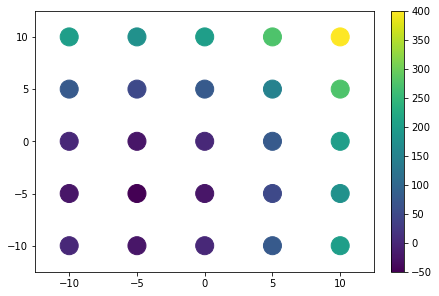
[5]:
xvalues = np.linspace(-10,10,5)
yvalues = np.linspace(-10,10,5)
xx, yy = data.flatmesh(xvalues, yvalues)
zz=xx**2+yy**2+10*xx+10*yy
print(zz)
plot.plot2d(xx,yy,zz,fill_missing=False,style='scatter',logz=False)
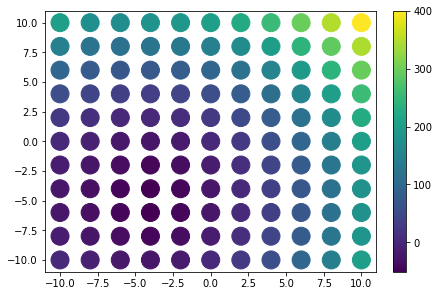
f=interp.interpolate(xx,yy,zz)
print(f(xx,yy))
xvalues = np.linspace(-10,10,11)
yvalues = np.linspace(-10,10,11)
xx, yy = data.flatmesh(xvalues, yvalues)
plot.plot2d(xx,yy,f(xx,yy),fill_missing=False,style='scatter',logz=False)
[  0. -25.   0.  75. 200. -25. -50. -25.  50. 175.   0. -25.   0.  75.
 200.  75.  50.  75. 150. 275. 200. 175. 200. 275. 400.]
[ 3.84453829e-15 -2.50000000e+01 -1.77635684e-14  7.50000000e+01
  2.00000000e+02 -2.50000000e+01 -5.00000000e+01 -2.50000000e+01
  5.00000000e+01  1.75000000e+02  1.06581410e-14 -2.50000000e+01
  7.10542736e-15  7.50000000e+01  2.00000000e+02  7.50000000e+01
  5.00000000e+01  7.50000000e+01  1.50000000e+02  2.75000000e+02
  2.00000000e+02  1.75000000e+02  2.00000000e+02  2.75000000e+02
  4.00000000e+02]
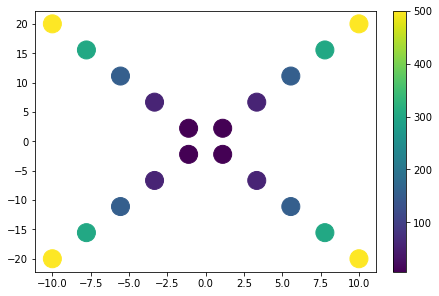
[6]:
xvalues = np.linspace(-10,10,10)
yvalues = xvalues*2
xx = xvalues
yy = yvalues
xx = np.append(xx,xx)
yy = np.append(yy,-yy)
zz = xx**2+yy**2
f_cub=interp.interpolate(xx,yy,zz)
f_lin=interp.interpolate(xx,yy,zz,interpolator='linear')
f_lind=interp.interpolate(xx,yy,zz,interpolator='linearnd')
f_bi=interp.interpolate(xx,yy,zz,interpolator='bivariatespline')
plot.plot2d(xx,yy,xx**2+yy**2,style='scatter',fill_missing=True,logz=False)
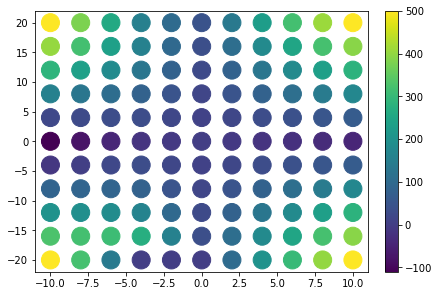
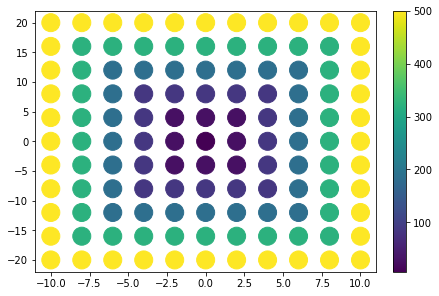
xvalues = np.linspace(-10,10,11)
yvalues = np.linspace(-20,20,11)
xx, yy = data.flatmesh(xvalues, yvalues)
plot.plot2d(xx,yy,f_cub(xx,yy),fill_missing=False,style='scatter',logz=False)
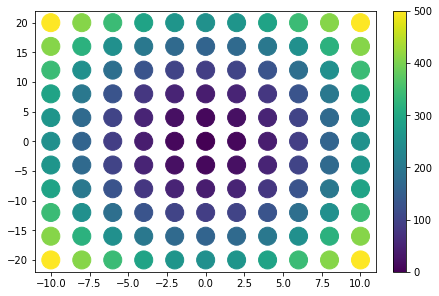
plot.plot2d(xx,yy,f_lin(xx,yy),fill_missing=False,style='scatter',logz=False)
plot.plot2d(xx,yy,f_lind(xx,yy),fill_missing=False,style='scatter',logz=False)
plot.plot2d(xx,yy,f_bi(xx,yy),fill_missing=False,style='scatter',logz=False)
/usr/lib/python3.8/site-packages/scipy/interpolate/_fitpack_impl.py:977: RuntimeWarning: No more knots can be added because the number of B-spline
coefficients already exceeds the number of data points m.
Probable causes: either s or m too small. (fp>s)
        kx,ky=3,3 nx,ny=9,9 m=20 fp=0.000000 s=0.000000
  warnings.warn(RuntimeWarning(_iermess2[ierm][0] + _mess))
/usr/lib/python3.8/site-packages/scipy/interpolate/_fitpack_impl.py:977: RuntimeWarning: No more knots can be added because the number of B-spline
coefficients already exceeds the number of data points m.
Probable causes: either s or m too small. (fp>s)
        kx,ky=1,1 nx,ny=6,8 m=20 fp=0.000000 s=0.000000
  warnings.warn(RuntimeWarning(_iermess2[ierm][0] + _mess))

[ ]: