Histogram
[1]:
import smpl
from smpl import plot
from smpl import stat
from smpl import functions as f
import numpy as np
np.random.seed(1337)
print(smpl.__version__)
0.0.94.0+dirty
Data will be binned for histogram like treatment if bins is set.
[2]:
x= np.random.randn(100000)
# Default uncertainty of bins is poisson distributed in y direction and none for x
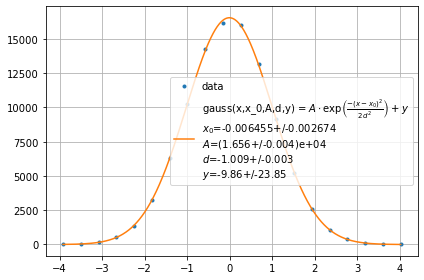
plot.fit(x,0,f.gauss,bins=20,label="data",binunc=stat.no_dist,init=True)
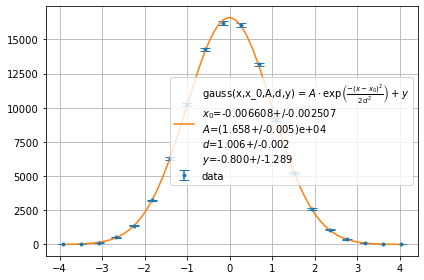
plot.fit(x,0,f.gauss,bins=20,label="data",init=True)
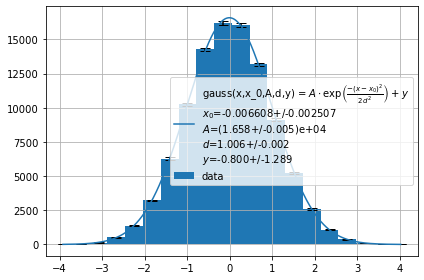
plot.fit(x,0,f.gauss,bins=20,label="data",fmt="hist",init=True)
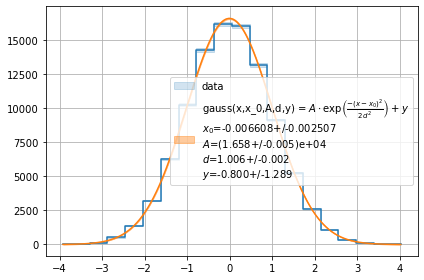
plot.fit(x,0,f.gauss,bins=20,label="data",sigmas=1,fmt="step",init=True)
[2]:
[-0.006607900447842807+/-0.0025071578988351073,
 16581.38509779463+/-50.72719890913742,
 1.0062518746208104+/-0.0018608377585222022,
 -0.8000071281729032+/-1.2886779525889007]
[ ]: