Interactive
[1]:
import numpy as np
import scipy
from ipywidgets import widgets
from smpl import animation, plot
[2]:
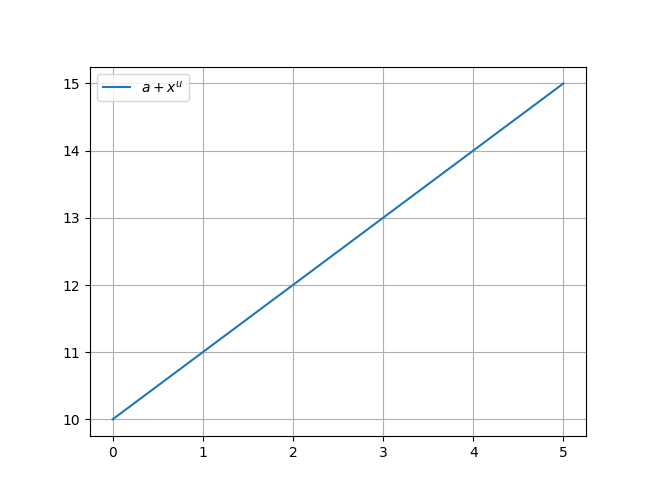
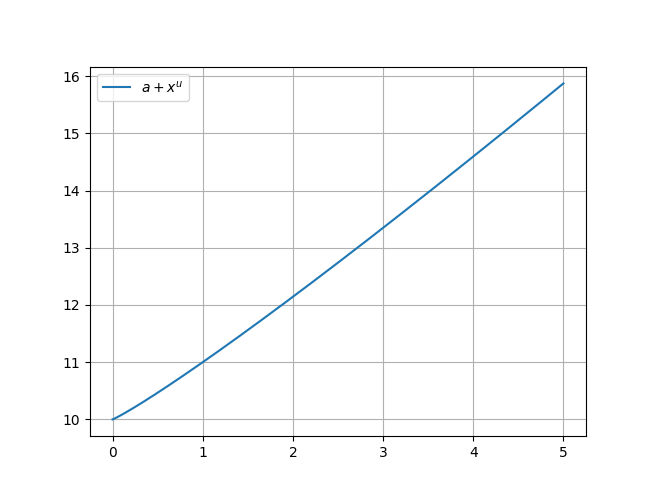
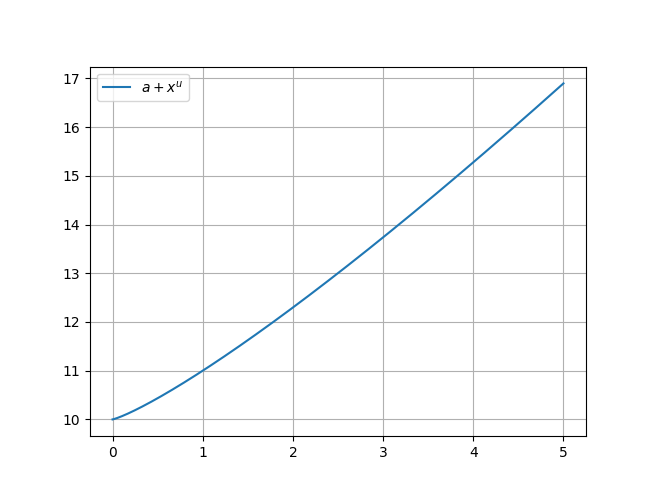
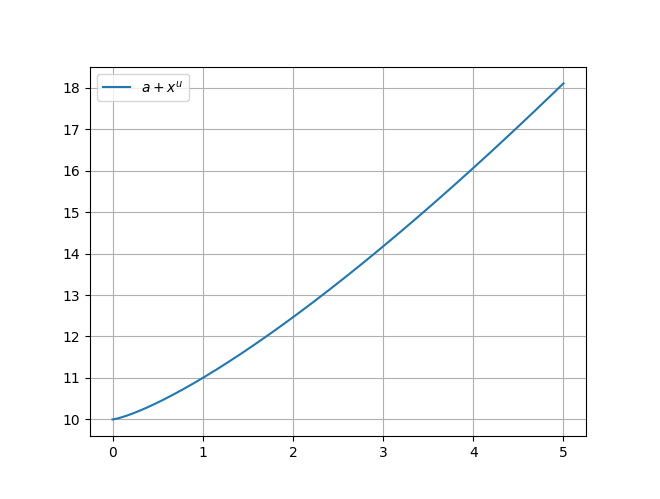
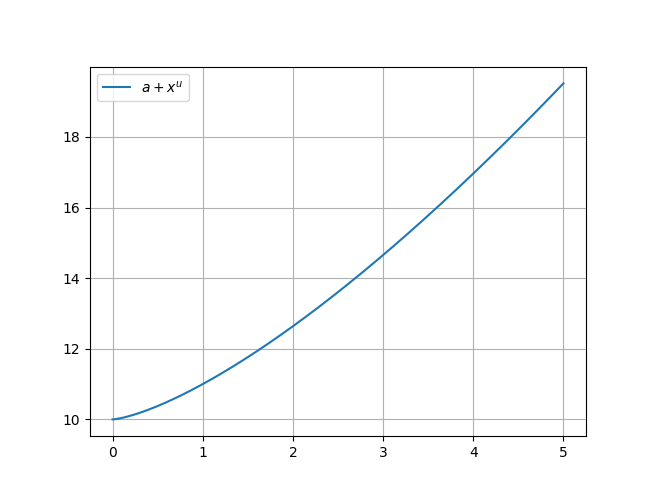
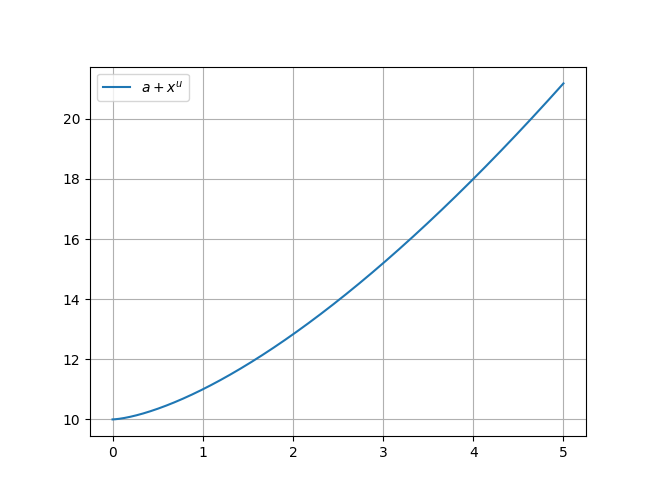
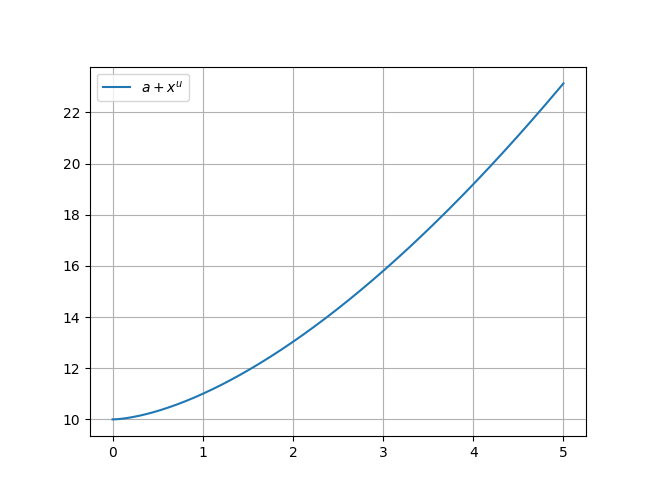
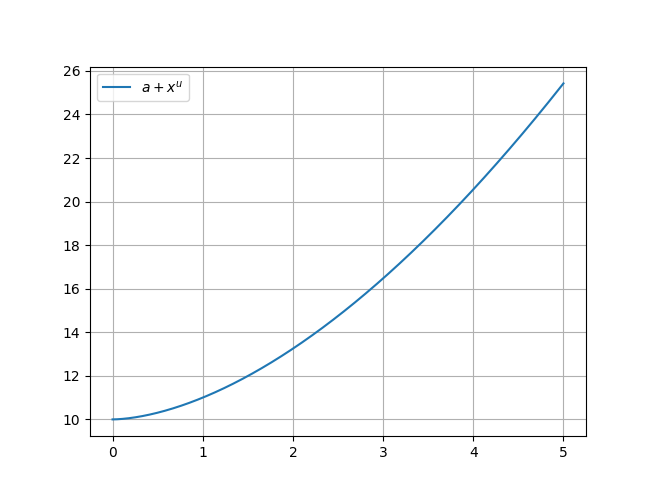
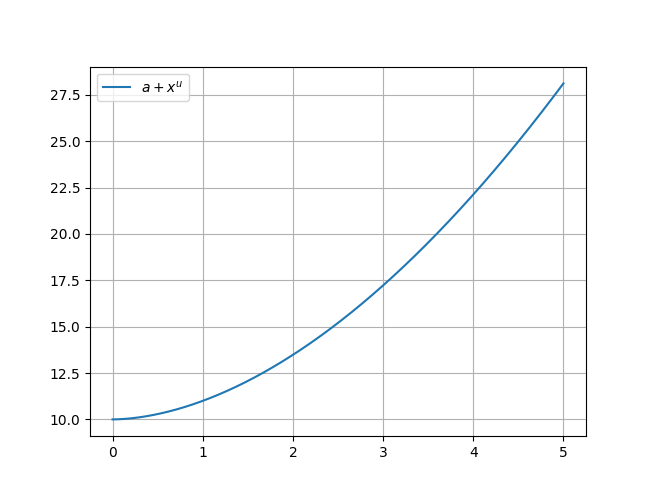
def fta(a, u=4.0):
plot.function(lambda x: x**u + a, xmin=0, xmax=5, init=True, tight=False)
print("Double click play for speedup.")
animation.interactive(
fta,
widgets.Play(
value=0,
min=0,
max=10,
step=1,
interval=500,
description="Press play",
disabled=False,
),
widgets.FloatSlider(value=1, min=0, max=1, step=0.1, description="u"),
prerender=True,
)
Double click play for speedup.
[2]:
[3]:
def fta(n=1.0, u=4.0):
plot.function(
lambda x: np.exp(n * np.log(x) - x) / u,
xmin=0.1,
xmax=100,
tight=False,
init=False,
)
animation.interactive(
fta,
widgets.IntSlider(value=1, min=1, max=10, description="n"),
widgets.IntSlider(value=1, min=1, max=10, description="u"),
prerender=True,
)
[3]:
[4]:
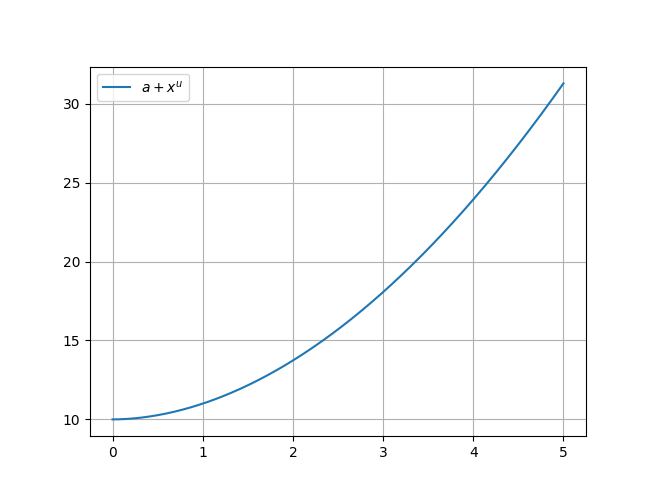
def fta(u=4.0):
animation.clear()
for a in np.linspace(0, 10, 10):
plot.function(lambda x: x**u + a, xmin=0, xmax=5, init=True, tight=False)
animation.frame()
ani = animation.animate(interval=10, blit=True)
display(ani.widget_gif())
animation.interactive(
fta,
widgets.FloatSlider(value=1, min=1, max=2, step=0.1, description="u"),
prerender=True,
auto_png=False,
)
[4]:
[5]:
# Approximate factorial by gamma
def fact(n):
return scipy.special.gamma(n + 1)
[6]:
# %matplotlib notebook
# plt.ioff()
# import ipywidgets
def fta(n=1.0):
plot.function(
lambda x: np.exp(n * np.log(x) - x), xmin=0.1, xmax=100, tight=False, init=False
)
plot.function(
lambda x: np.exp(n * np.log(n) - n - (x - n) ** 2 / 2 / n),
xmin=0.1,
xmax=100,
tight=False,
init=False,
)
fac = fact(n)
sti = np.sqrt(2 * np.pi * n) * n**n * np.exp(-n)
# print("FAKULTÄT("+str(n)+") = " + str(fac))
# print("STIRLING("+str(n)+") = " + str(sti))
# print("REL-DIFF(" + str(n)+") = "+ str((sti-fac)/fac*100) + "%")
animation.interactive(
fta, widgets.IntSlider(min=1, max=130, step=1, value=1, description="n")
)
[6]:
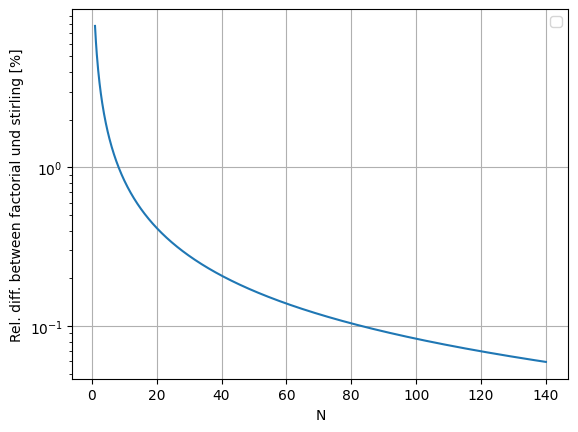
[7]:
plot.function(
lambda n: (fact(n) - np.sqrt(2 * np.pi * n) * n**n * np.exp(-n)) / fact(n) * 100,
xmin=1,
xmax=140,
xlabel="N",
ylabel="Rel. diff. between factorial und stirling [%]",
label="",
logy=True,
tight=False,
init=True,
)
/home/docs/checkouts/readthedocs.org/user_builds/smpl/envs/v1.5.1/lib/python3.12/site-packages/smpl/plot.py:943: UserWarning: No artists with labels found to put in legend. Note that artists whose label start with an underscore are ignored when legend() is called with no argument.
plt.legend(loc=kwargs["lpos"])
[ ]: