Linear Fit
[1]:
import numpy as np
import uncertainties as unc
import uncertainties.unumpy as unp

from smpl import fit, io, plot
from smpl import functions as f
[2]:
data = np.loadtxt(io.find_file("test_linear_data.txt", 3))
xdata = data[:, 0]
xerr = data[:, 2]
ydata = data[:, 1]
yerr = data[:, 3]
x = unp.uarray(xdata, xerr)
y = unp.uarray(ydata, yerr)
[3]:
data
[3]:
array([[0. , 1. , 0.1, 0.2],
       [1. , 2. , 0.2, 0.1],
       [2. , 3. , 0.3, 0.1],
       [3. , 5. , 0.1, 0.4],
       [4. , 5. , 0.1, 0.1],
       [5. , 6. , 0.1, 0.2]])
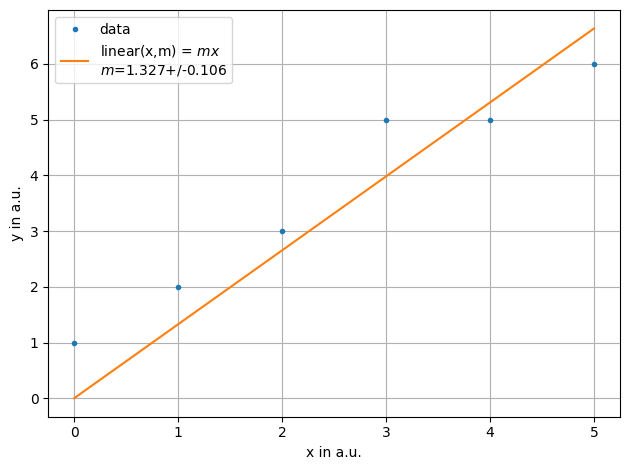
SciPy
[4]:
ff = plot.fit(
    xdata,
    ydata,
    fmt=".",
    label="data",
    xaxis="x in a.u.",
    yaxis="y in a.u.",
    function=f.linear,
    params=[1],
)
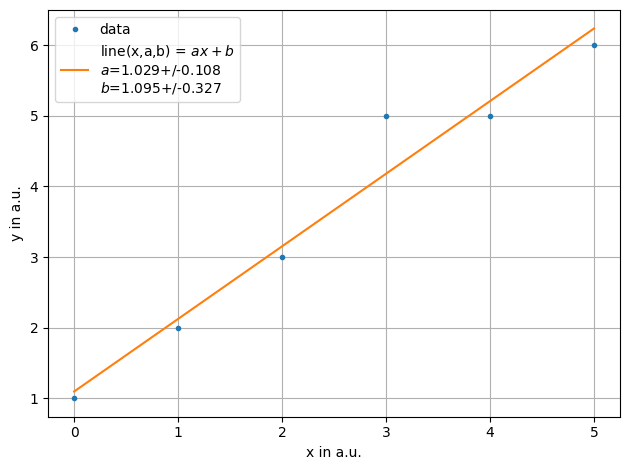
[5]:
ff = plot.fit(
    xdata,
    ydata,
    fmt=".",
    label="data",
    xaxis="x in a.u.",
    yaxis="y in a.u.",
    function=f.line,
    params=[1, 2],
)
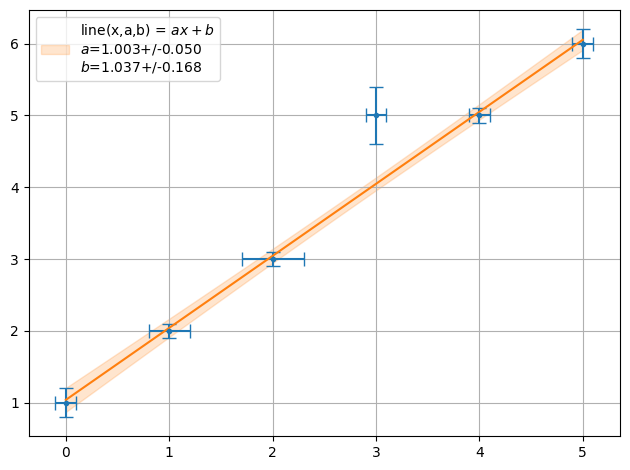
[6]:
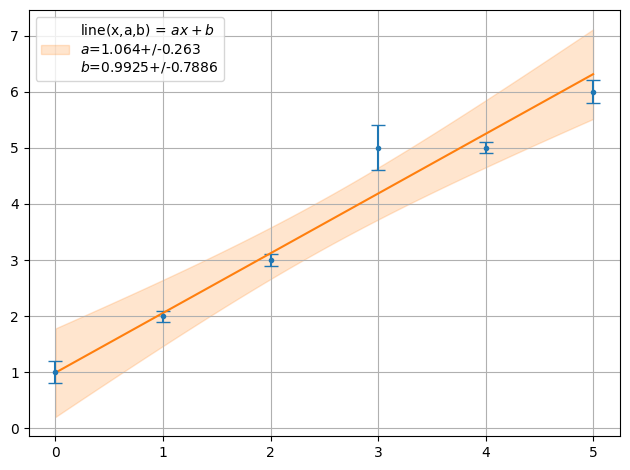
ff = plot.fit(x, y, fmt=".", function=f.line, params=[1, 1], sigmas=1, lpos=2)
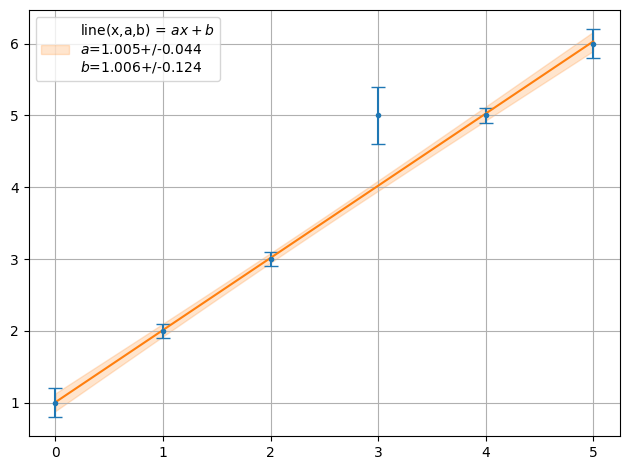
[7]:
ff = plot.fit(
    xdata, y, fmt=".", function=f.line, params=[1, 1], sigmas=1, lpos=2, also_data=True
)
print("Chi2 = ", fit.Chi2(xdata, y, f.line, ff))
Chi2 = 5.883584796166781
Correlations
Let’s take a look at correlations on the example of calculating the y axis intercept. Again:
[8]:
a, b = plot.fit(
    xdata,
    ydata,
    fmt=".",
    label="data",
    xaxis="x in a.u.",
    yaxis="y in a.u.",
    function=f.line,
    sigmas=1,
    extrapolate_min=-2,
)
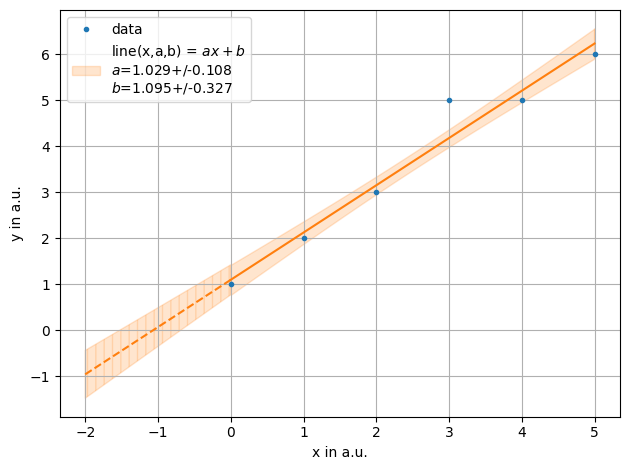
Let’s calculated the intersection with the x axis, given by \(-b/a\), with correlation
[9]:
-b / a
[9]:
-1.0648148148148089+/-0.4156953391902814
and without correlations
[10]:
a_nocorr = unc.ufloat(plot.unv(a), plot.usd(a))
b_nocorr = unc.ufloat(plot.unv(b), plot.usd(b))
-b_nocorr / a_nocorr
[10]:
-1.0648148148148089+/-0.33752053055607584
While the mean agrees the uncertainties are not the same.
The Lines drawn in the plot are also correlated and cross the axis at -0.67 and -1.51 corresponding to an uncertainties of -0.42.
Minuit
[11]:
ff = plot.fit(
    xdata,
    y,
    fmt=".",
    function=f.line,
    params=[1, 1],
    sigmas=1,
    lpos=2,
    fitter=fit.Fitter.MINUIT_LEASTSQUARES,
)
print("Chi2 = ", fit.Chi2(xdata, y, f.line, ff))
Chi2 = 5.958263165324413

[12]:
ff = plot.fit(
    xdata,
    y,
    fmt=".",
    function=f.line,
    params=[1, 1],
    sigmas=1,
    lpos=2,
    fitter=fit.Fitter.SCIPY_ODR,
)
print("Chi2 = ", fit.Chi2(xdata, y, f.line, ff))
Chi2 = 2.1622470651728745
[ ]: