Interpolate
[1]:
import numpy as np
from uncertainties import unumpy as unp

from smpl import data, plot, stat
from smpl import interpolate as interp
Interpolate 1d
[2]:
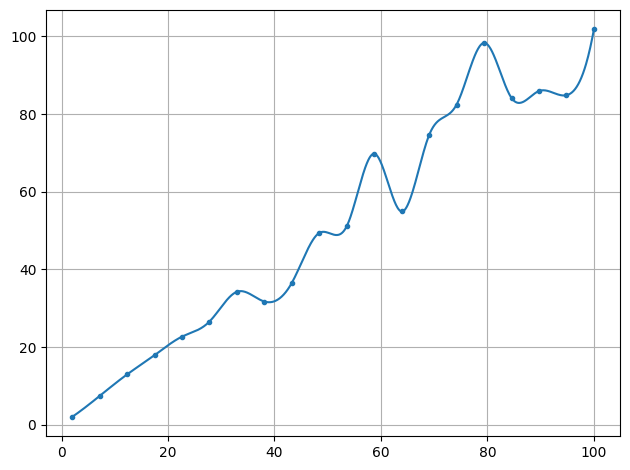
x = np.linspace(2, 100, 20)
y = stat.noisy(x)
plot.data(x, y, interpolate=True)
plot.show()
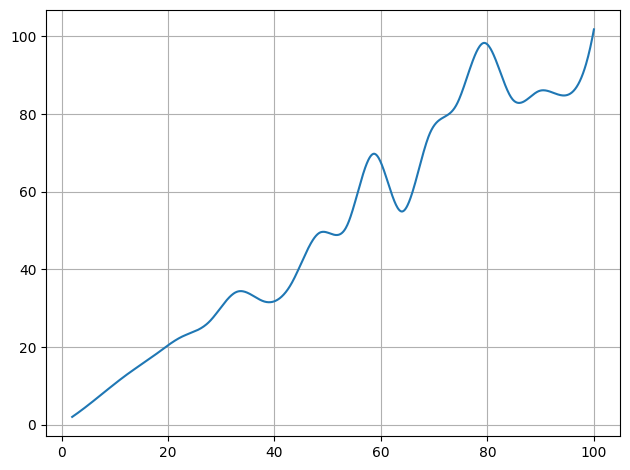
plot.data(x, y, interpolate=True, also_data=False)
plot.show()
[3]:
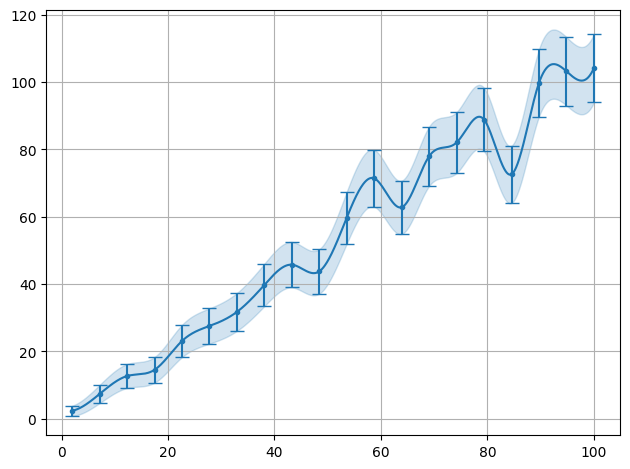
x = np.linspace(2, 100, 20)
y = stat.poisson_dist(stat.noisy(x))
plot.data(x, y, interpolate=True, sigmas=1, show=True)
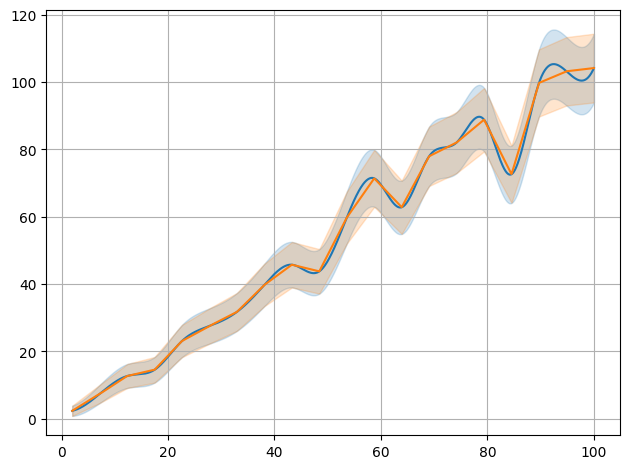
plot.data(x, y, interpolate=True, sigmas=1, also_data=False)
plot.data(
x, y, interpolate=True, sigmas=1, also_data=False, init=False, interpolator="linear"
)
""
[3]:
''
[4]:
x = np.linspace(2, 100, 10)
y = np.exp(-stat.noisy(x, std=0.05))

ff1 = plot.data(
    x,
    y,
    interpolate=True,
    also_data=False,
    interpolator="linear",
    logy=True,
    interpolate_label="linear",
)
ff2 = plot.data(
    x,
    y,
    interpolate=True,
    also_data=False,
    interpolator="exp",
    logy=True,
    init=False,
    interpolate_label="exp",
)


f1 = interp.interpolate(x, y, interpolator="exp")
f2 = lambda x_: np.exp(interp.interpolate(x, unp.log(y), interpolator="linear")(x_))
x2 = np.linspace(2, 100, 100)

plot.data(x2, np.exp(-x2), logy=True, init=False, label="true data")
plot.data(x, f2(x), logy=True, init=False, label="shifted interpolate data")
plot.show()

print("lin Chi2:" + str(stat.Chi2(ff1[0](x2), np.exp(-x2))))
print("exp Chi2:" + str(stat.Chi2(ff2[0](x2), np.exp(-x2))))
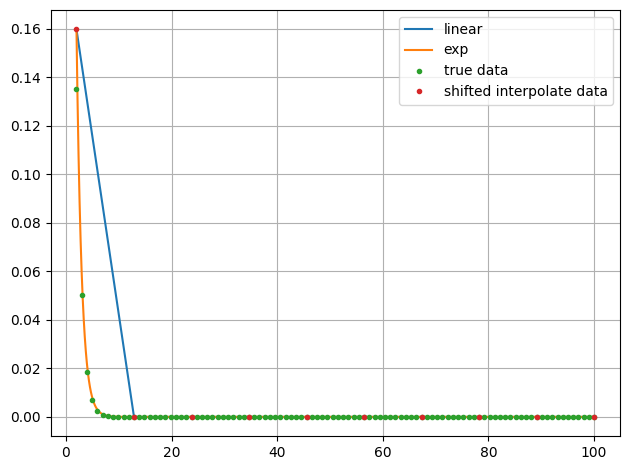
lin Chi2:0.06288353746033237
exp Chi2:0.0006868943563240778
Interpolate 2d
[5]:
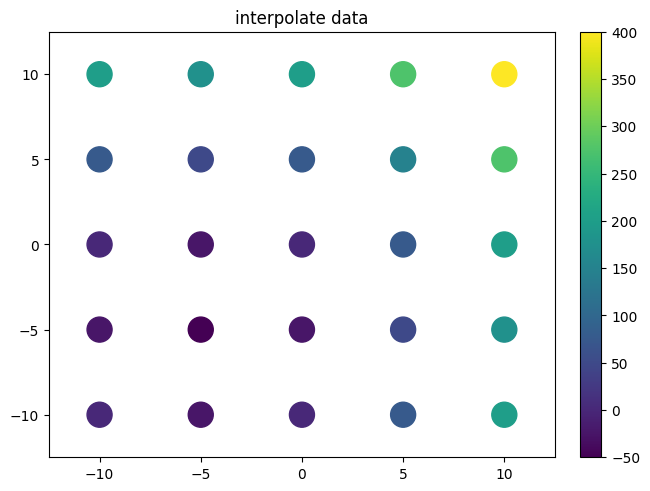
xvalues = np.linspace(-10, 10, 5)
yvalues = np.linspace(-10, 10, 5)
xx, yy = data.flatmesh(xvalues, yvalues)
zz = xx**2 + yy**2 + 10 * xx + 10 * yy
print(zz)
plot.plot2d(
xx,
yy,
zz,
fill_missing=False,
style="scatter",
logz=False,
title="interpolate data",
)
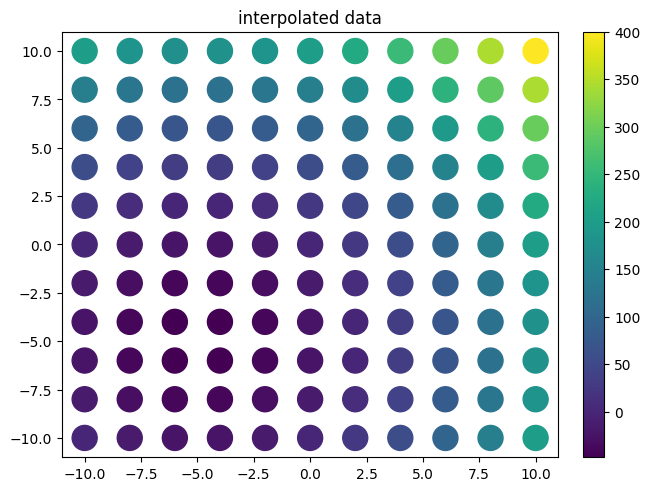
f = interp.interpolate(xx, yy, zz)
print(f(xx, yy))
xvalues = np.linspace(-10, 10, 11)
yvalues = np.linspace(-10, 10, 11)
xx, yy = data.flatmesh(xvalues, yvalues)
plot.plot2d(
xx,
yy,
f(xx, yy),
fill_missing=False,
style="scatter",
logz=False,
title="interpolated data",
)
[  0. -25.   0.  75. 200. -25. -50. -25.  50. 175.   0. -25.   0.  75.
 200.  75.  50.  75. 150. 275. 200. 175. 200. 275. 400.]
[-3.71981473e-15 -2.50000000e+01 -7.10542736e-15  7.50000000e+01
  2.00000000e+02 -2.50000000e+01 -5.00000000e+01 -2.50000000e+01
  5.00000000e+01  1.75000000e+02 -7.10542736e-15 -2.50000000e+01
  1.15463195e-14  7.50000000e+01  2.00000000e+02  7.50000000e+01
  5.00000000e+01  7.50000000e+01  1.50000000e+02  2.75000000e+02
  2.00000000e+02  1.75000000e+02  2.00000000e+02  2.75000000e+02
  4.00000000e+02]
[6]:
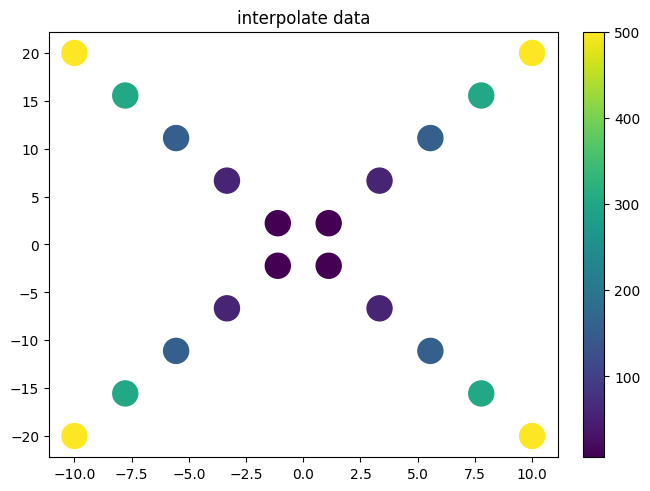
xvalues = np.linspace(-10, 10, 10)
yvalues = xvalues * 2
xx = xvalues
yy = yvalues
xx = np.append(xx, xx)
yy = np.append(yy, -yy)
zz = xx**2 + yy**2
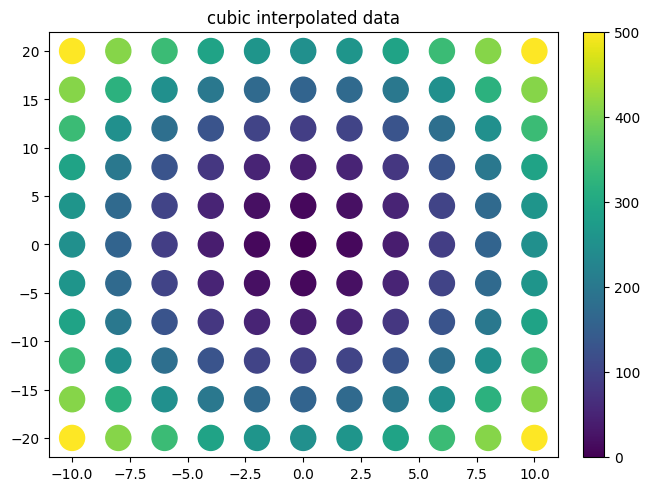
f_cub = interp.interpolate(xx, yy, zz)
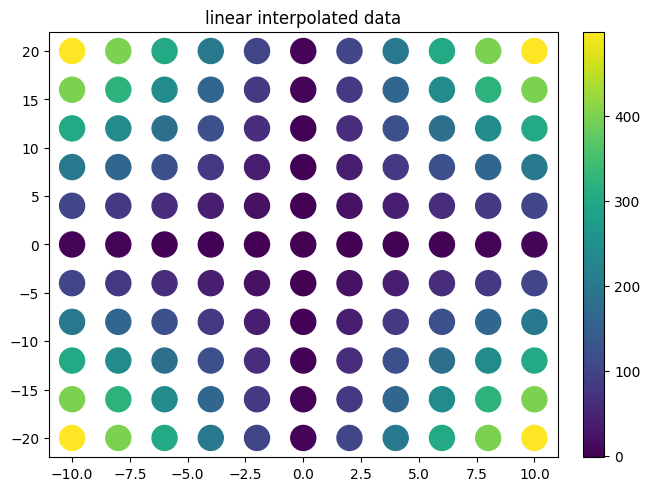
f_lin = interp.interpolate(xx, yy, zz, interpolator="linear")
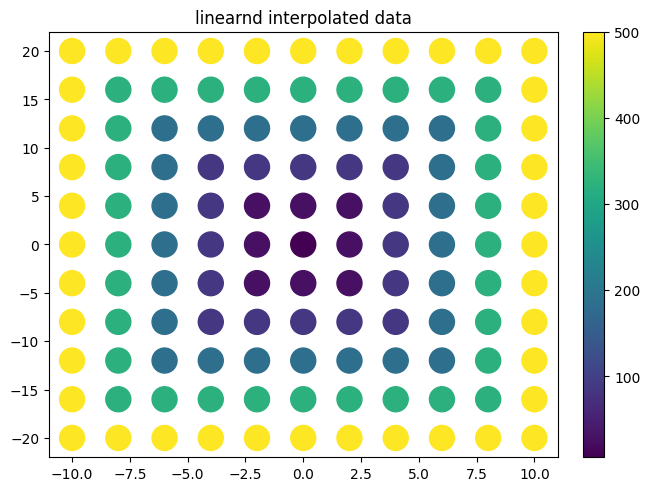
f_lind = interp.interpolate(xx, yy, zz, interpolator="linearnd")
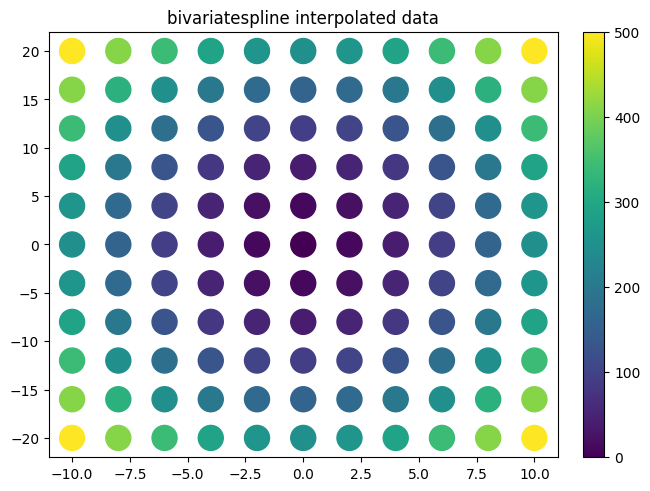
f_bi = interp.interpolate(xx, yy, zz, interpolator="bivariatespline")
plot.plot2d(
xx,
yy,
xx**2 + yy**2,
style="scatter",
fill_missing=True,
logz=False,
title="interpolate data",
)
xvalues = np.linspace(-10, 10, 11)
yvalues = np.linspace(-20, 20, 11)
xx, yy = data.flatmesh(xvalues, yvalues)
plot.plot2d(
xx,
yy,
f_cub(xx, yy),
fill_missing=False,
style="scatter",
logz=False,
title="cubic interpolated data",
)
plot.plot2d(
xx,
yy,
f_lin(xx, yy),
fill_missing=False,
style="scatter",
logz=False,
title="linear interpolated data",
)
plot.plot2d(
xx,
yy,
f_lind(xx, yy),
fill_missing=False,
style="scatter",
logz=False,
title="linearnd interpolated data",
)
plot.plot2d(
xx,
yy,
f_bi(xx, yy),
fill_missing=False,
style="scatter",
logz=False,
title="bivariatespline interpolated data",
)
/home/docs/checkouts/readthedocs.org/user_builds/smpl/envs/v1.5.5/lib/python3.12/site-packages/smpl/interpolate.py:139: UserWarning: Bad interpolation. Increase Order or symmetrize error.
  warnings.warn("Bad interpolation. Increase Order or symmetrize error.")
scipy vs smpl code
Example taken from https://docs.scipy.org/doc/scipy/reference/generated/scipy.interpolate.LinearNDInterpolator.html
[7]:
import numpy as np

rng = np.random.default_rng()
x = rng.random(10) - 0.5
y = rng.random(10) - 0.5
z = np.hypot(x, y)
lX = np.linspace(min(x), max(x))
lY = np.linspace(min(y), max(y))
X, Y = np.meshgrid(lX, lY)  # 2D grid for interpolation
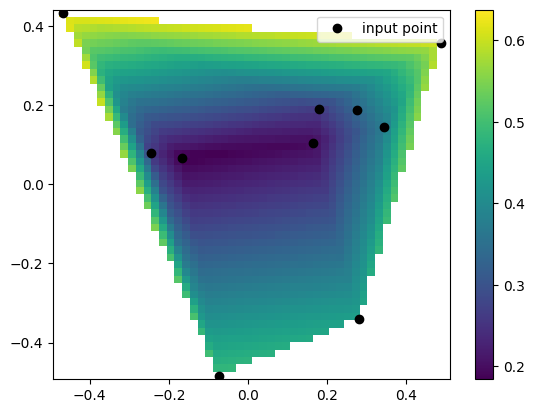
scipy code
[8]:
import matplotlib.pyplot as plt
from scipy.interpolate import LinearNDInterpolator

# interpolate
interp = LinearNDInterpolator(list(zip(x, y)), z)
# evaluate interpoaltion function
Z = interp(X, Y)
# plot it
plt.pcolormesh(X, Y, Z, shading="auto")
plt.plot(x, y, "ok", label="input point")
plt.legend()
plt.colorbar()
plt.axis("equal")
plt.show()
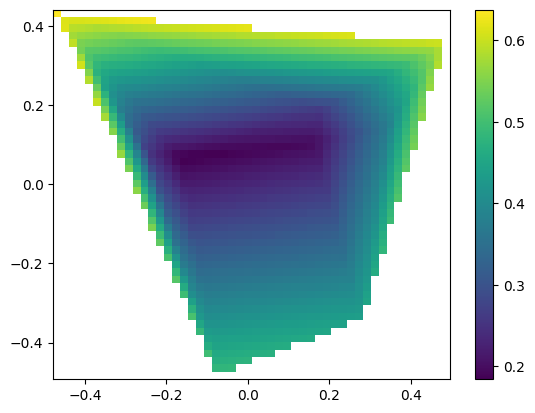
smpl code
[9]:
from smpl import data, plot
from smpl import interpolate as interpol

f = interpol.interpolate(x, y, z, interpolator="linearnd")
plot.plot2d(X, Y, f(X, Y), logz=False)
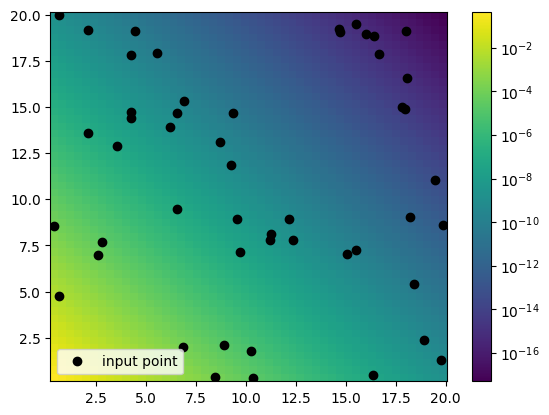
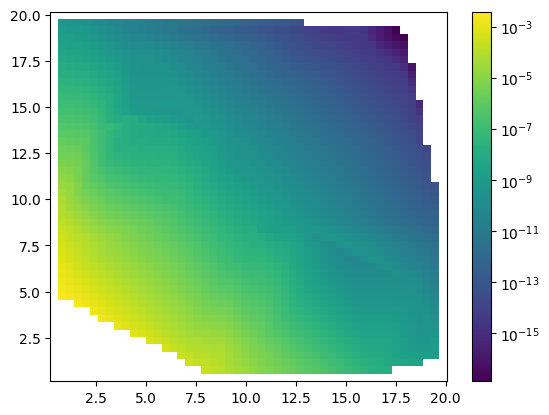
Pre and Post transformations
It might turn out that some behaviour/shape of the function is known. Including this into the interpolation improves the result as was seen in previos 1d expolential interpolation section.
[10]:
import numpy as np

rng = np.random.default_rng()
x = 20 * rng.random(50)
y = 20 * rng.random(50)
tx = np.linspace(min(x), max(x))
ty = np.linspace(min(y), max(y))
z = np.exp(-stat.noisy(x + y, std=0.05))
X, Y = np.meshgrid(tx, ty)  # 2D grid for interpolation
tz = np.exp(-np.abs(X) - np.abs(Y))
[11]:
plot.plot2d(X, Y, tz, logz=True)
plt.plot(x, y, "ok", label="input point")
plt.legend()
[11]:
<matplotlib.legend.Legend at 0x7ffbba74e8a0>
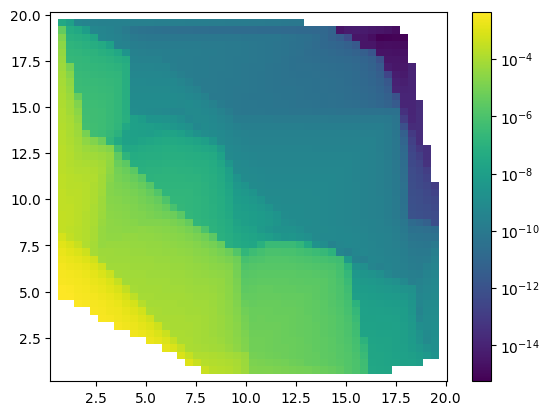
[12]:
f = interpol.interpolate(x, y, z, interpolator="linearnd")
plot.plot2d(X, Y, f(X, Y), logz=True)
r = f(X, Y).flatten()[~np.isnan(f(X, Y).flatten())]
t = tz.flatten()[~np.isnan(f(X, Y).flatten())]
print("Chi2: " + str(stat.Chi2(r, t)))
print("R2: " + str(stat.R2(r, t)))
print("var: " + str(stat.average_deviation(r, t)))
Chi2: 0.00016149985960609248
R2: -0.05522503010181179
var: (2+/-5)e+02
[13]:
f = interpol.interpolate(x, y, z, interpolator="linearnd", pre=np.log, post=np.exp)
plot.plot2d(X, Y, f(X, Y), logz=True)
r = f(X, Y).flatten()[~np.isnan(f(X, Y).flatten())]
t = tz.flatten()[~np.isnan(f(X, Y).flatten())]
print("Chi2: " + str(stat.Chi2(r, t)))
print("R2: " + str(stat.R2(r, t)))
print("var: " + str(stat.average_deviation(r, t)))
Chi2: 1.1313024624281435e-06
R2: -0.008095992254377293
var: 0.7+/-0.6
[ ]:
[ ]: