smpl.functions
A list of various functions.
|
const(x) = \(m\) |
|
cos(x,a,f,phi) = \(a \cos{\left(2 \pi f \left(- \phi + x\right) \right)}\) |
|
cos_abs(x,a,f,phi) = \(a \left|{\cos{\left(2 \pi f \left(- \phi + x\right) \right)}}\right|\) |
|
cube(x,a,b,c,d) = \(a x^{3} + b x^{2} + c x + d\) |
|
exponential(x,c,y_0) = \(y_{0} e^{c x}\) |
|
gauss(x,x_0,a,d,y) = \(a e^{\frac{\left(-1\right) \left(x - x_{0}\right)^{2}}{2 d^{2}}} + y\) |
|
line(x,a,b) = \(a x + b\) |
|
linear(x,m) = \(m x\) |
|
log(x,c,y_0) = \(y_{0} \log{\left(c x \right)}\) |
|
lorentz(x,x_0,a,d,y) = \(\frac{a}{\pi d \left(1 + \frac{\left(x - x_{0}\right)^{2}}{d^{2}}\right)} + y\) |
|
sin(x,a,f,phi) = \(a \sin{\left(2 \pi f \left(- \phi + x\right) \right)}\) |
|
sqrt(x,a,b,c) = \(a \sqrt{b + x} + c\) |
|
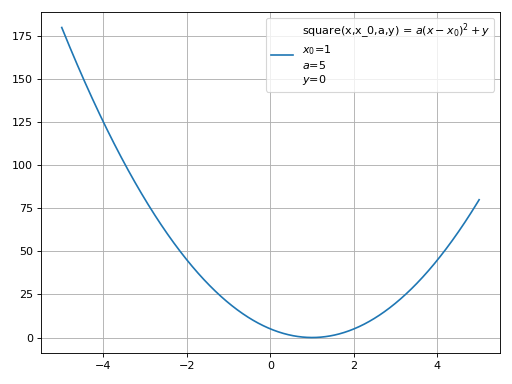
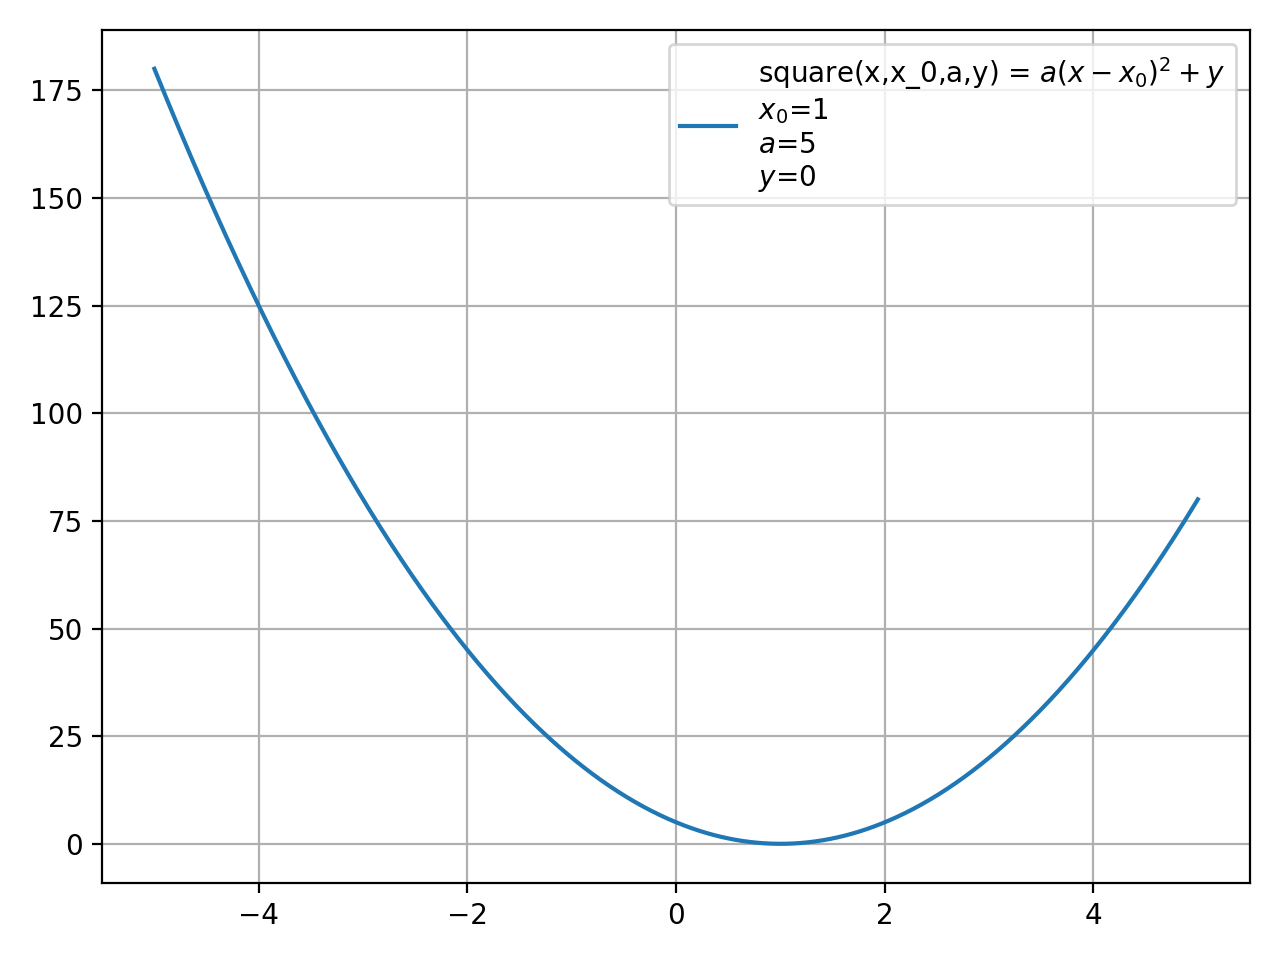
square(x,x_0,a,y) = \(a \left(x - x_{0}\right)^{2} + y\) |
|
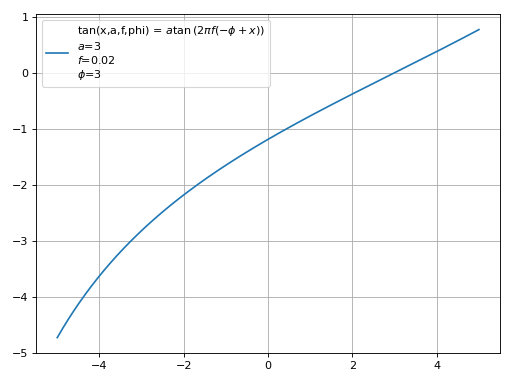
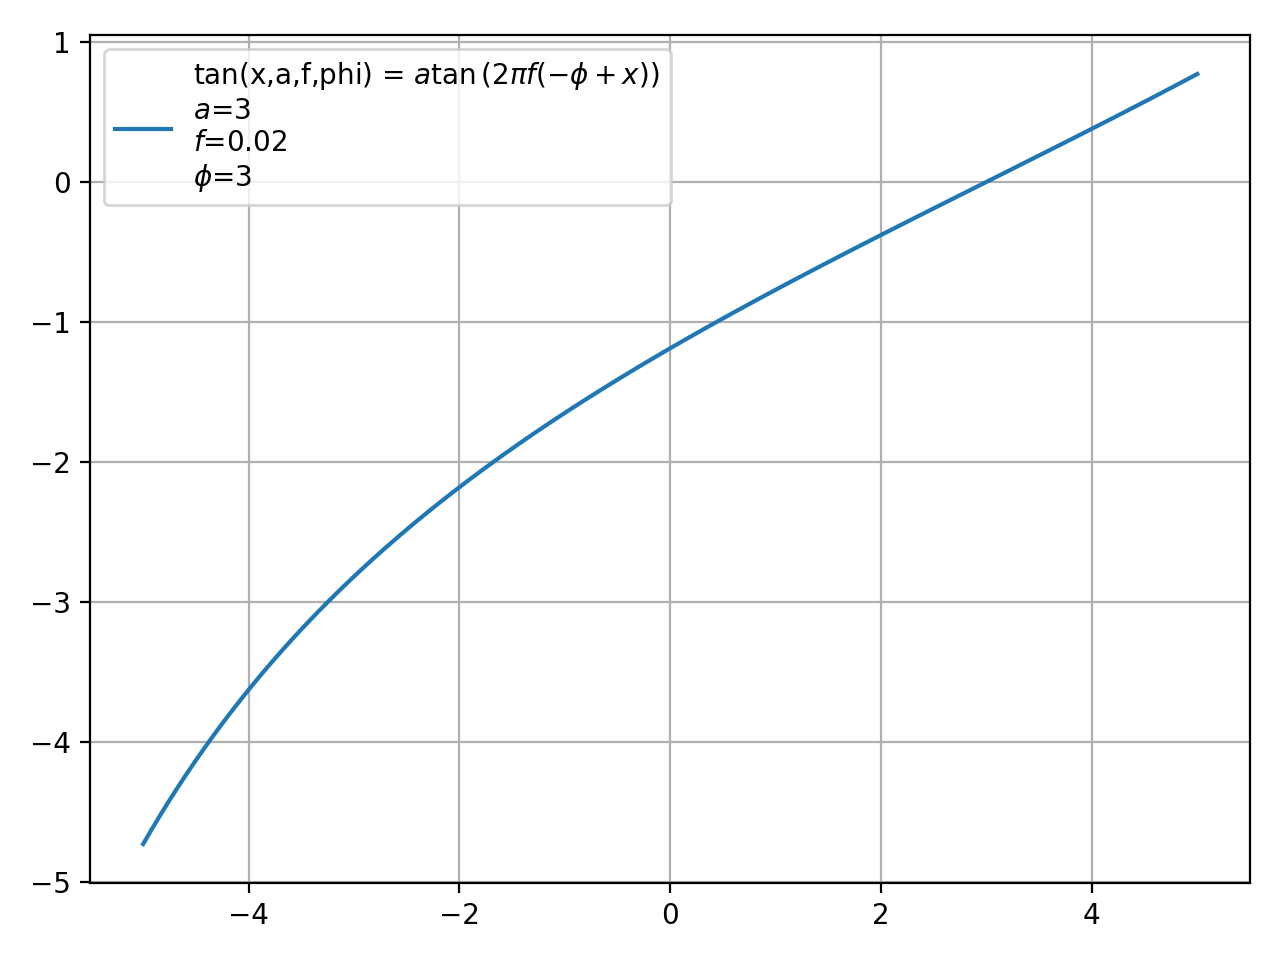
tan(x,a,f,phi) = \(a \tan{\left(2 \pi f \left(- \phi + x\right) \right)}\) |
Functions
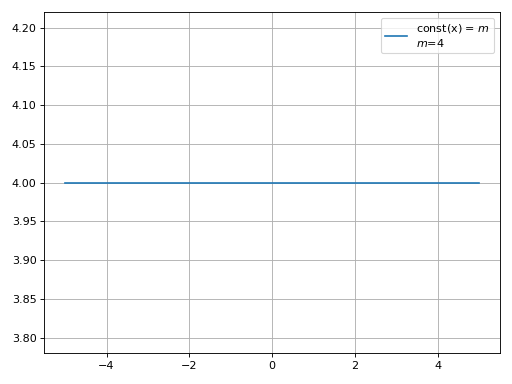
- smpl.functions.const(x, m)[source]
const(x) = \(m\)
>>> from smpl.functions.functions import const
>>> from smpl import plot
>>> plot.function(const,4,xmin=-5,xmax=5)
(Source code, png, hires.png, pdf)
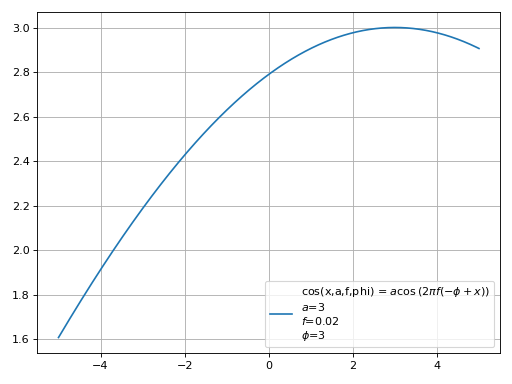
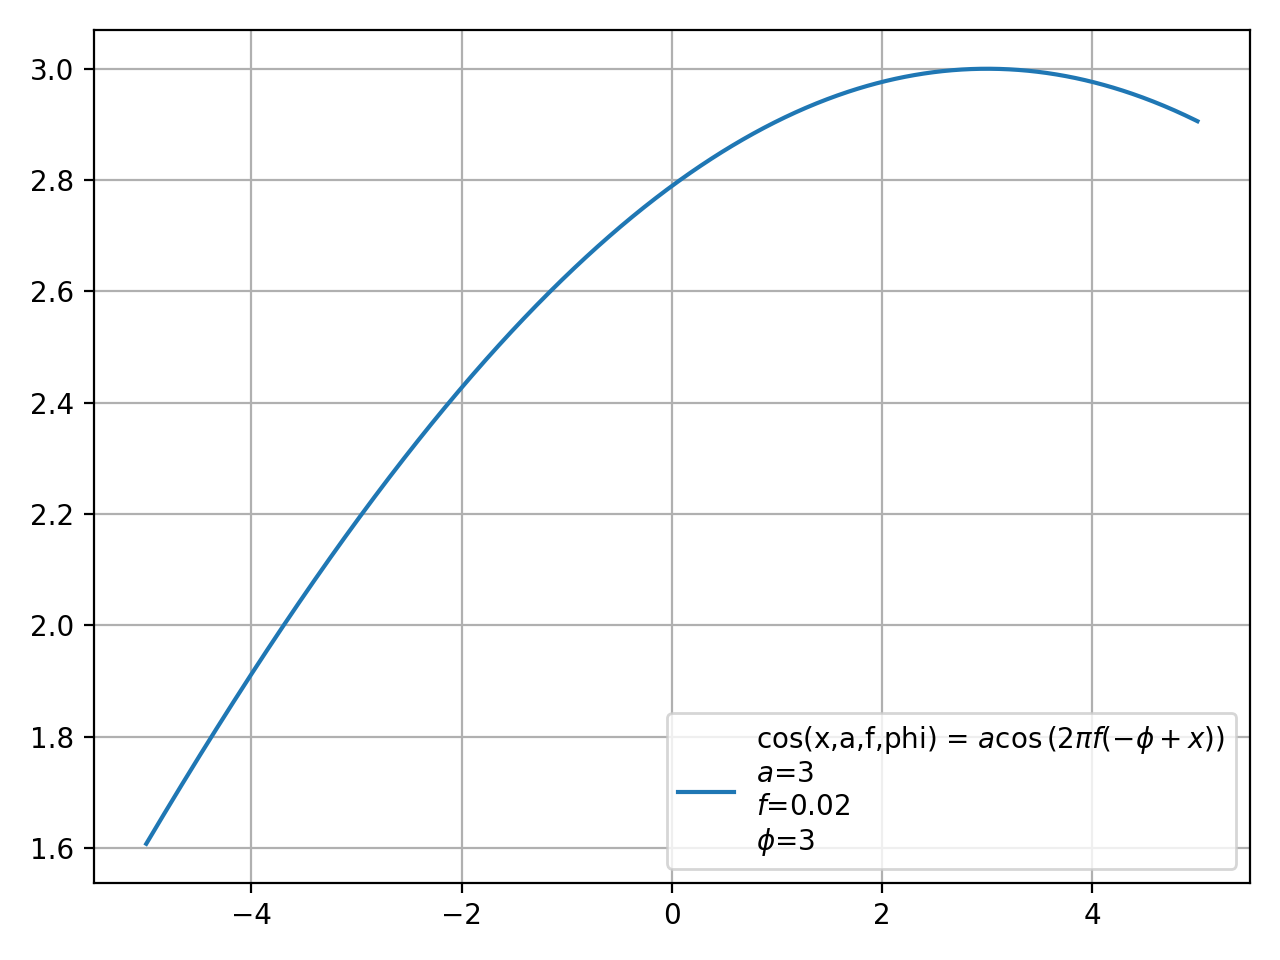
- smpl.functions.cos(x, a, f, phi)[source]
cos(x,a,f,phi) = \(a \cos{\left(2 \pi f \left(- \phi + x\right) \right)}\)
>>> from smpl.functions.functions import cos
>>> from smpl import plot
>>> plot.function(cos,3,0.02,3,xmin=-5,xmax=5)
(Source code, png, hires.png, pdf)

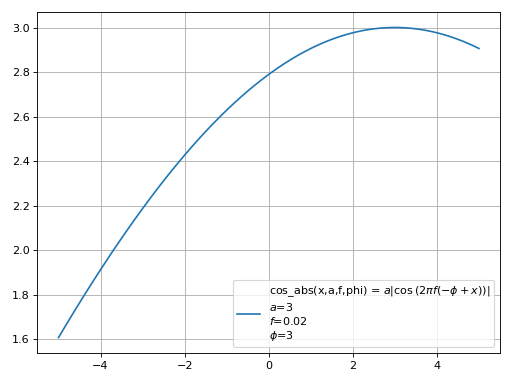
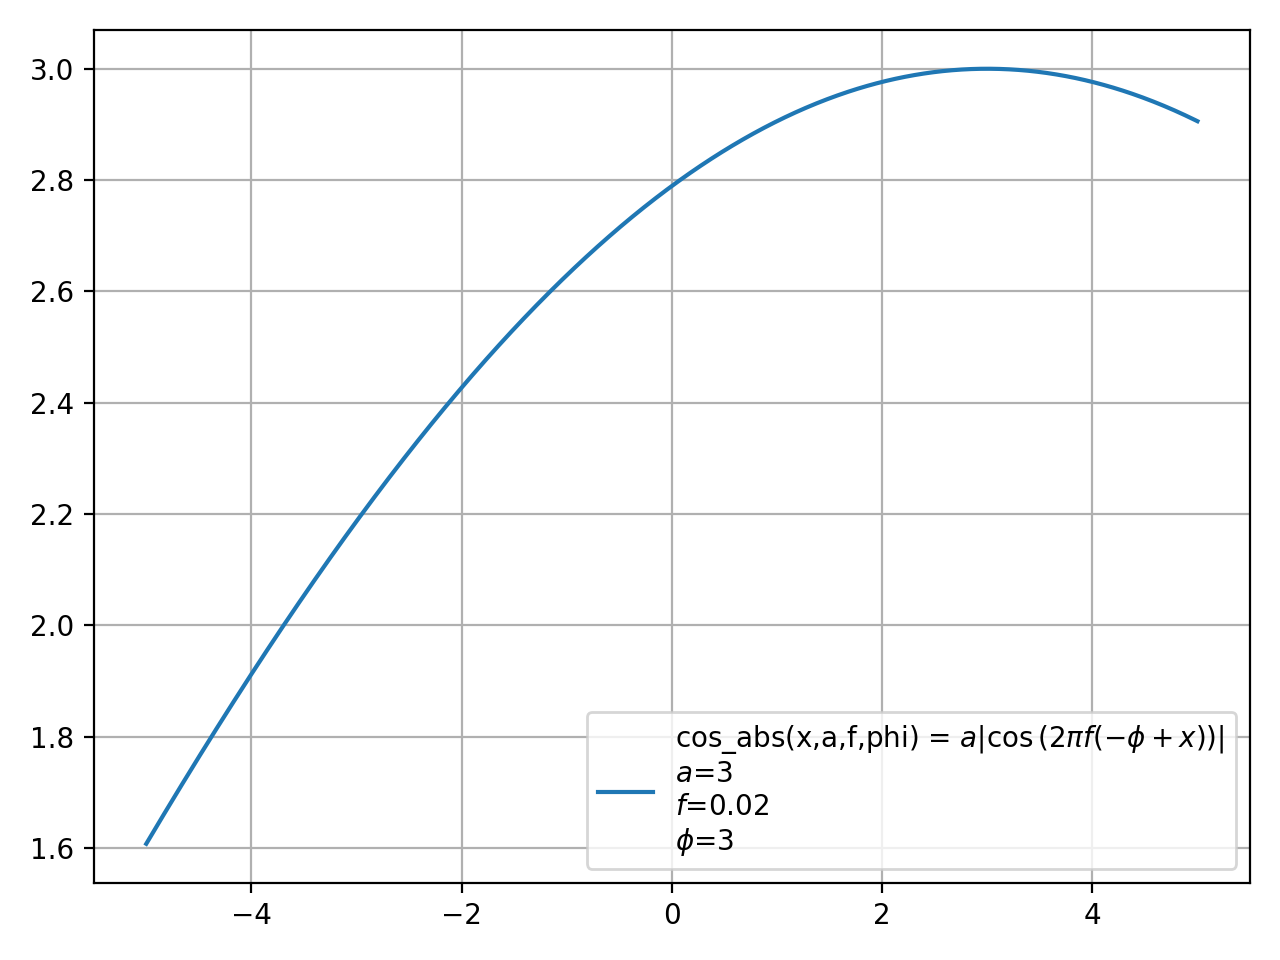
- smpl.functions.cos_abs(x, a, f, phi)[source]
cos_abs(x,a,f,phi) = \(a \left|{\cos{\left(2 \pi f \left(- \phi + x\right) \right)}}\right|\)
>>> from smpl.functions.functions import cos_abs
>>> from smpl import plot
>>> plot.function(cos_abs,3,0.02,3,xmin=-5,xmax=5)
(Source code, png, hires.png, pdf)

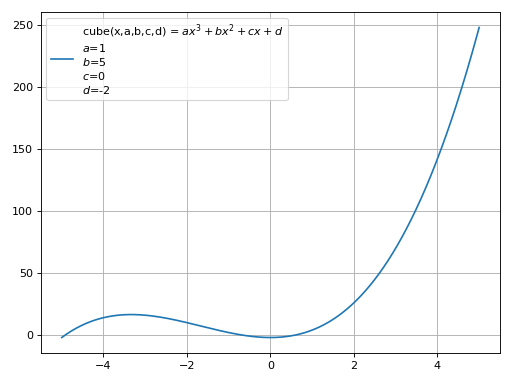
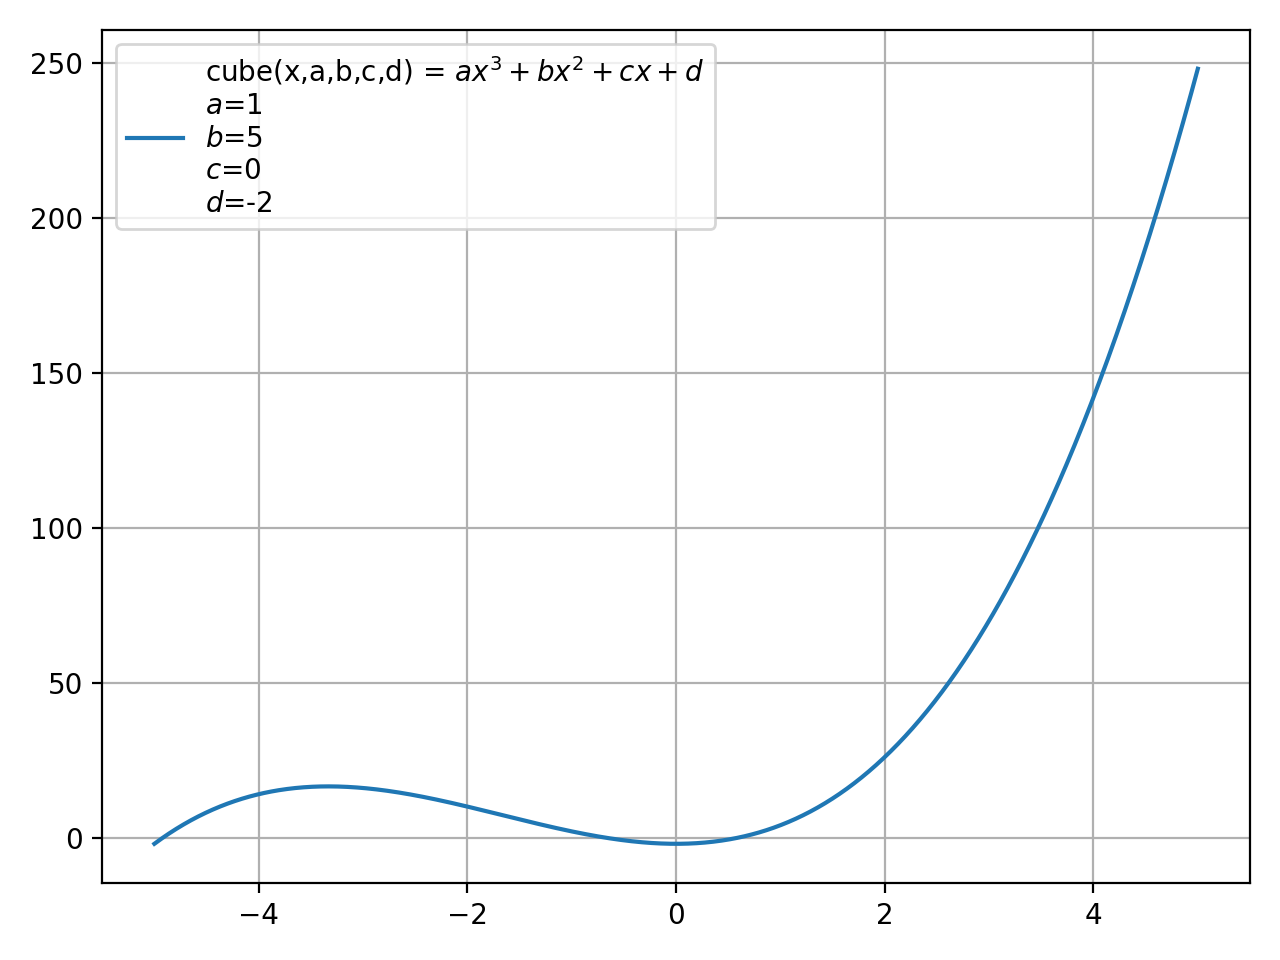
- smpl.functions.cube(x, a, b, c, d)[source]
cube(x,a,b,c,d) = \(a x^{3} + b x^{2} + c x + d\)
>>> from smpl.functions.functions import cube
>>> from smpl import plot
>>> plot.function(cube,1,5,0,-2,xmin=-5,xmax=5)
(Source code, png, hires.png, pdf)

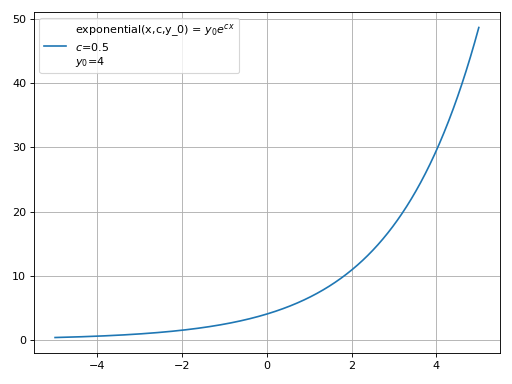
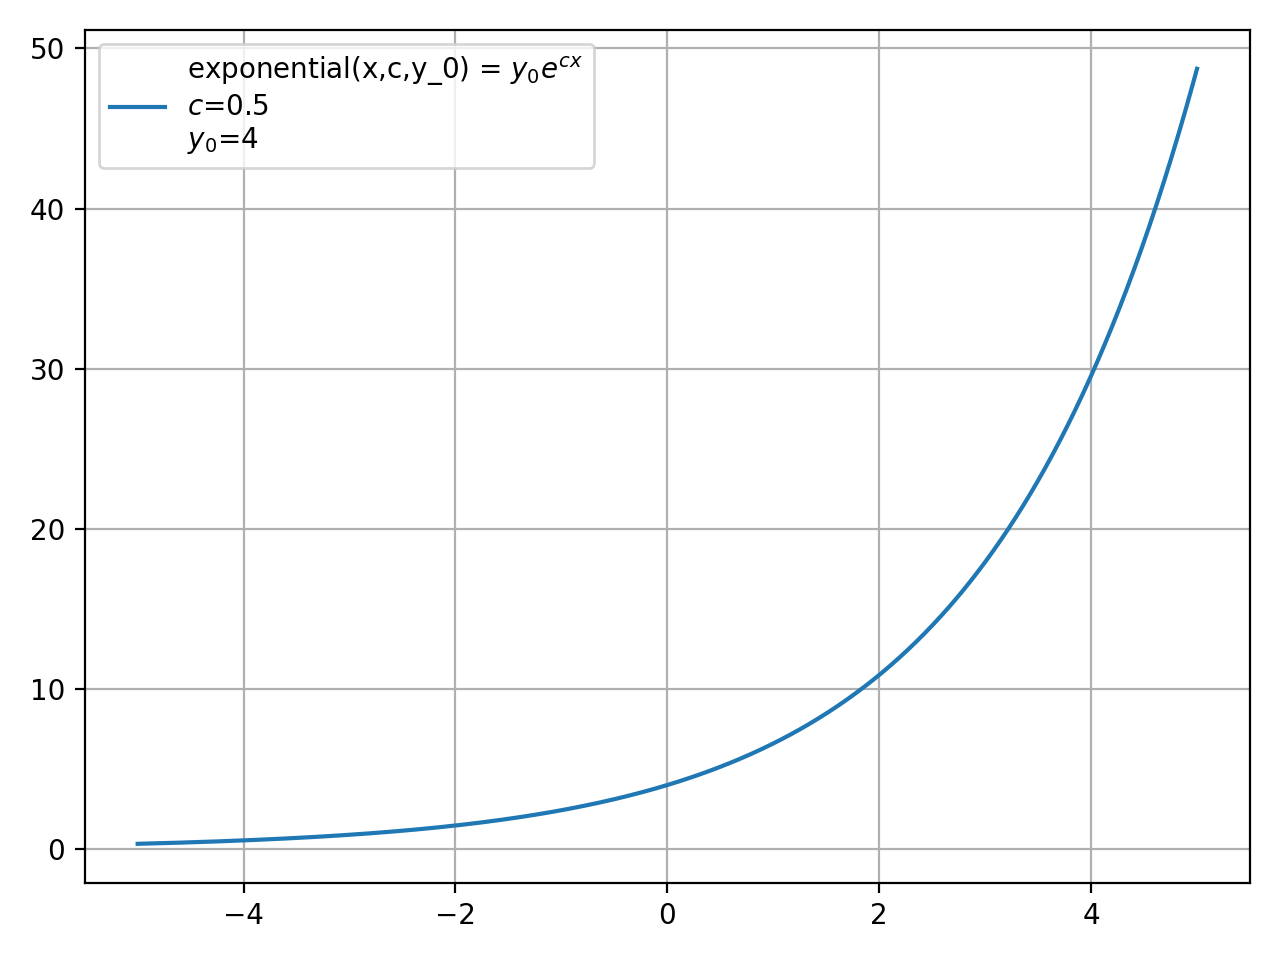
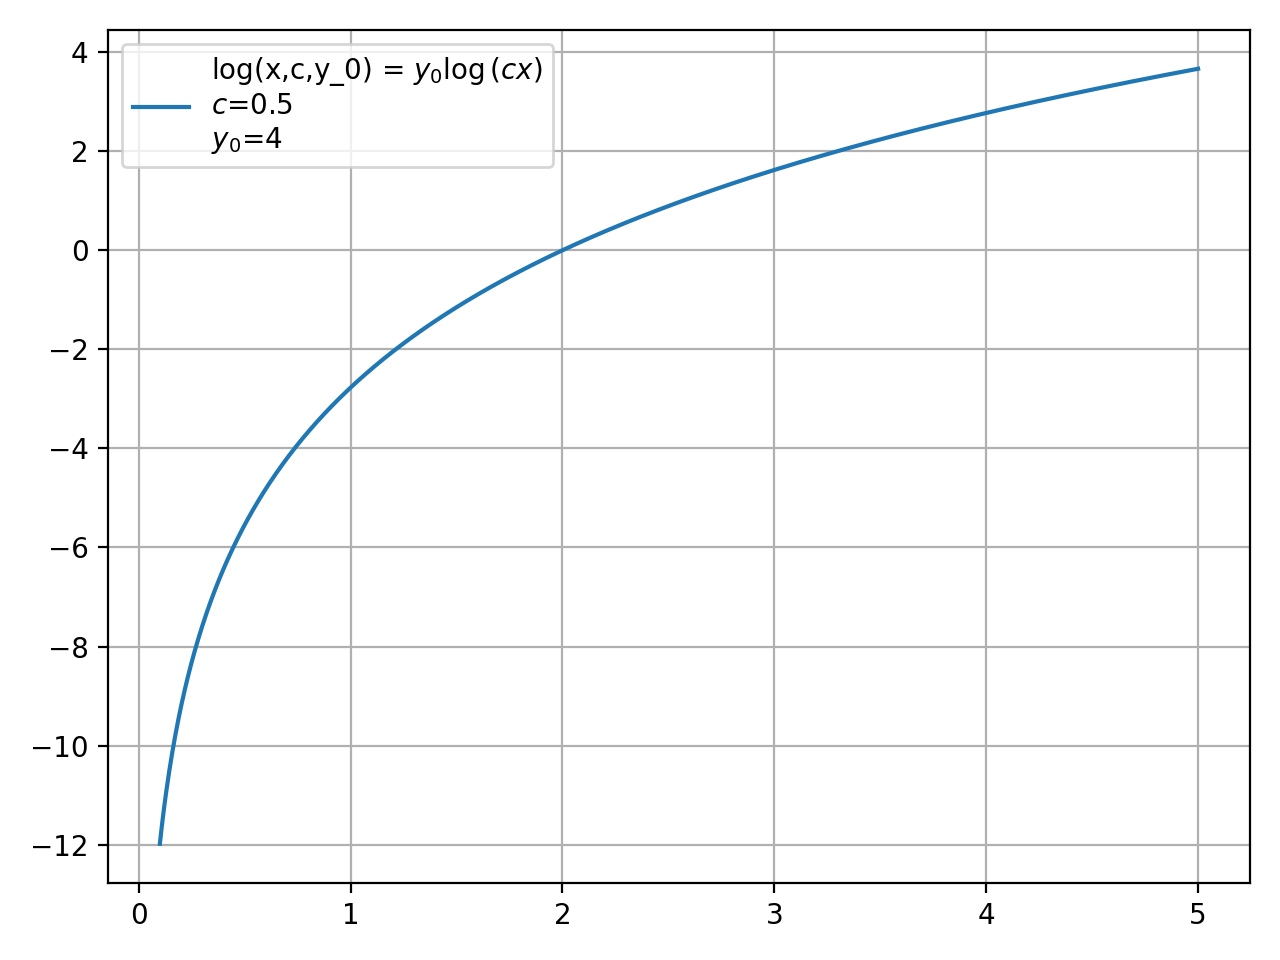
- smpl.functions.exp(x, c, y_0)
exponential(x,c,y_0) = \(y_{0} e^{c x}\)
>>> from smpl.functions.functions import exponential
>>> from smpl import plot
>>> plot.function(exponential,0.5,4,xmin=-5,xmax=5)
(Source code, png, hires.png, pdf)
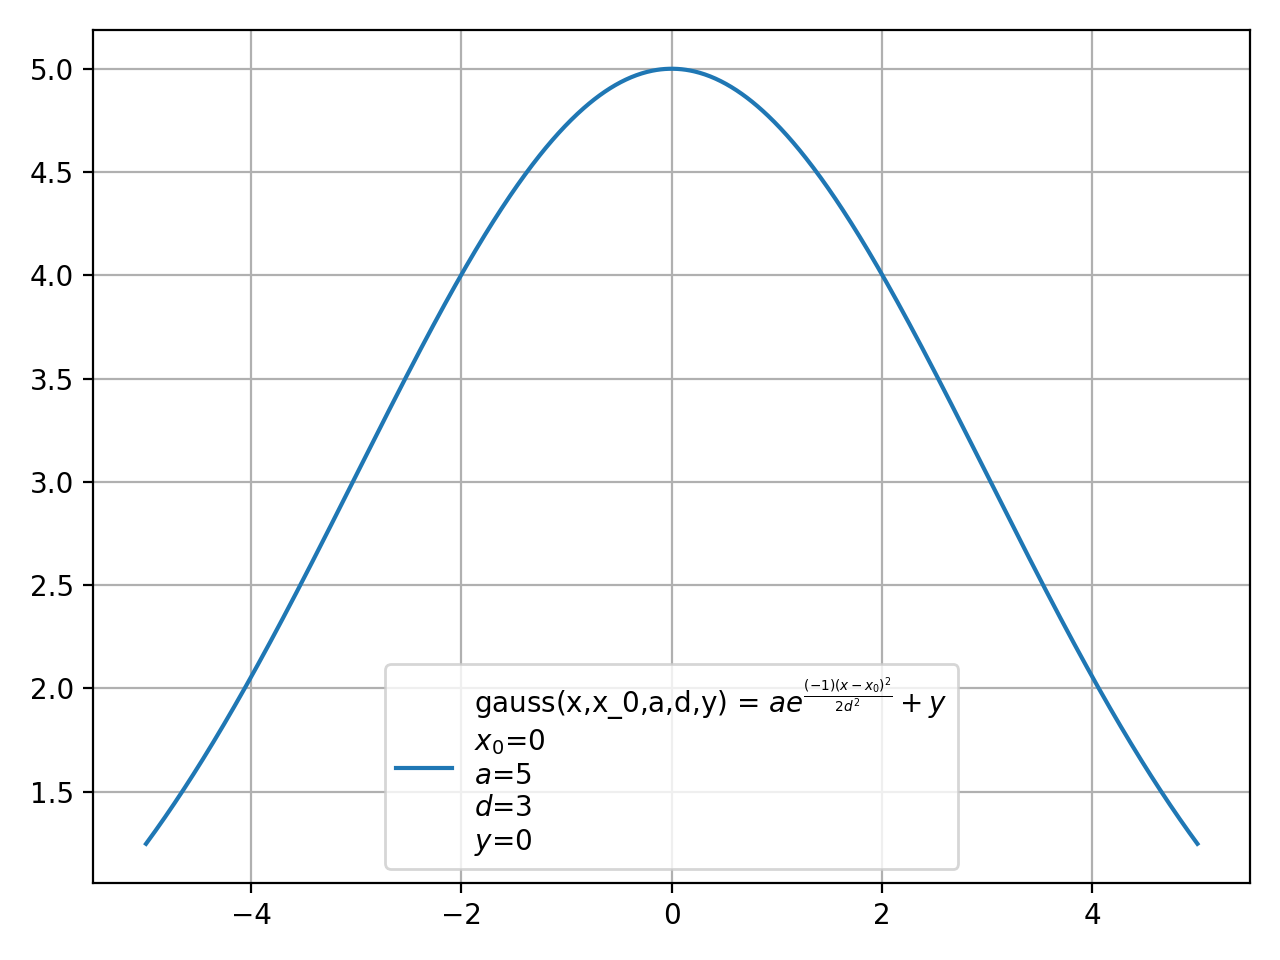
- smpl.functions.gauss(x, x_0, a, d, y)[source]
gauss(x,x_0,a,d,y) = \(a e^{\frac{\left(-1\right) \left(x - x_{0}\right)^{2}}{2 d^{2}}} + y\)
>>> from smpl.functions.functions import gauss
>>> from smpl import plot
>>> plot.function(gauss,0,5,3,0,xmin=-5,xmax=5)
(Source code, png, hires.png, pdf)

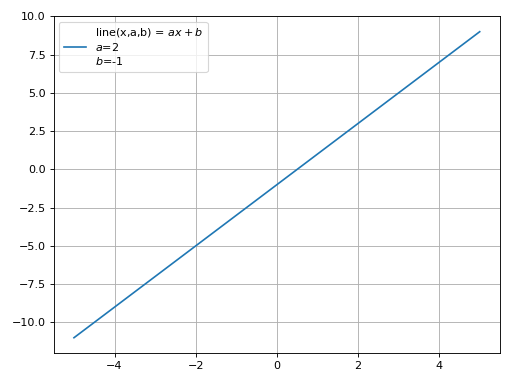
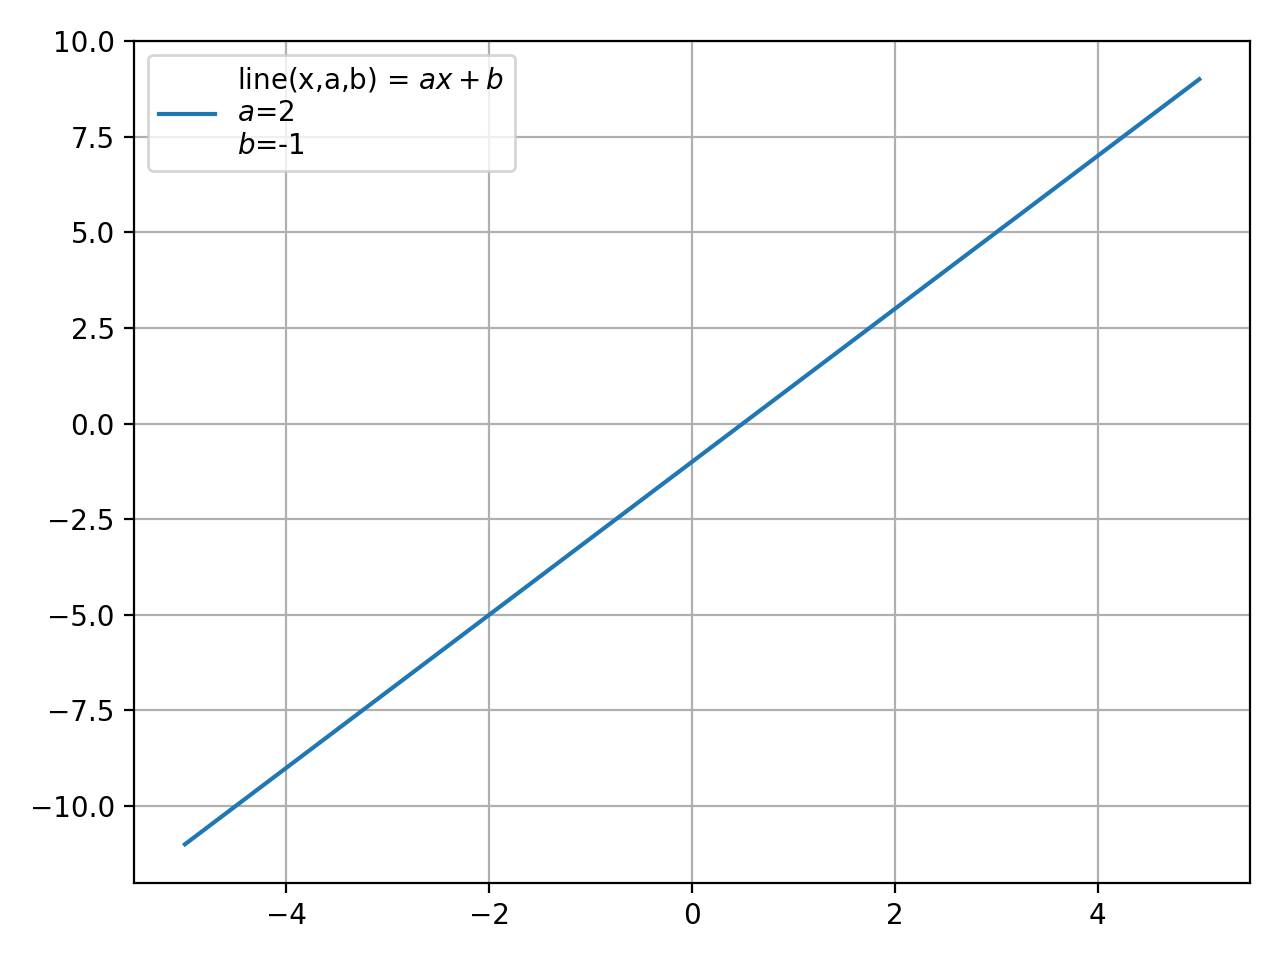
- smpl.functions.line(x, a, b)[source]
line(x,a,b) = \(a x + b\)
>>> from smpl.functions.functions import line
>>> from smpl import plot
>>> plot.function(line,2,-1,xmin=-5,xmax=5)
(Source code, png, hires.png, pdf)
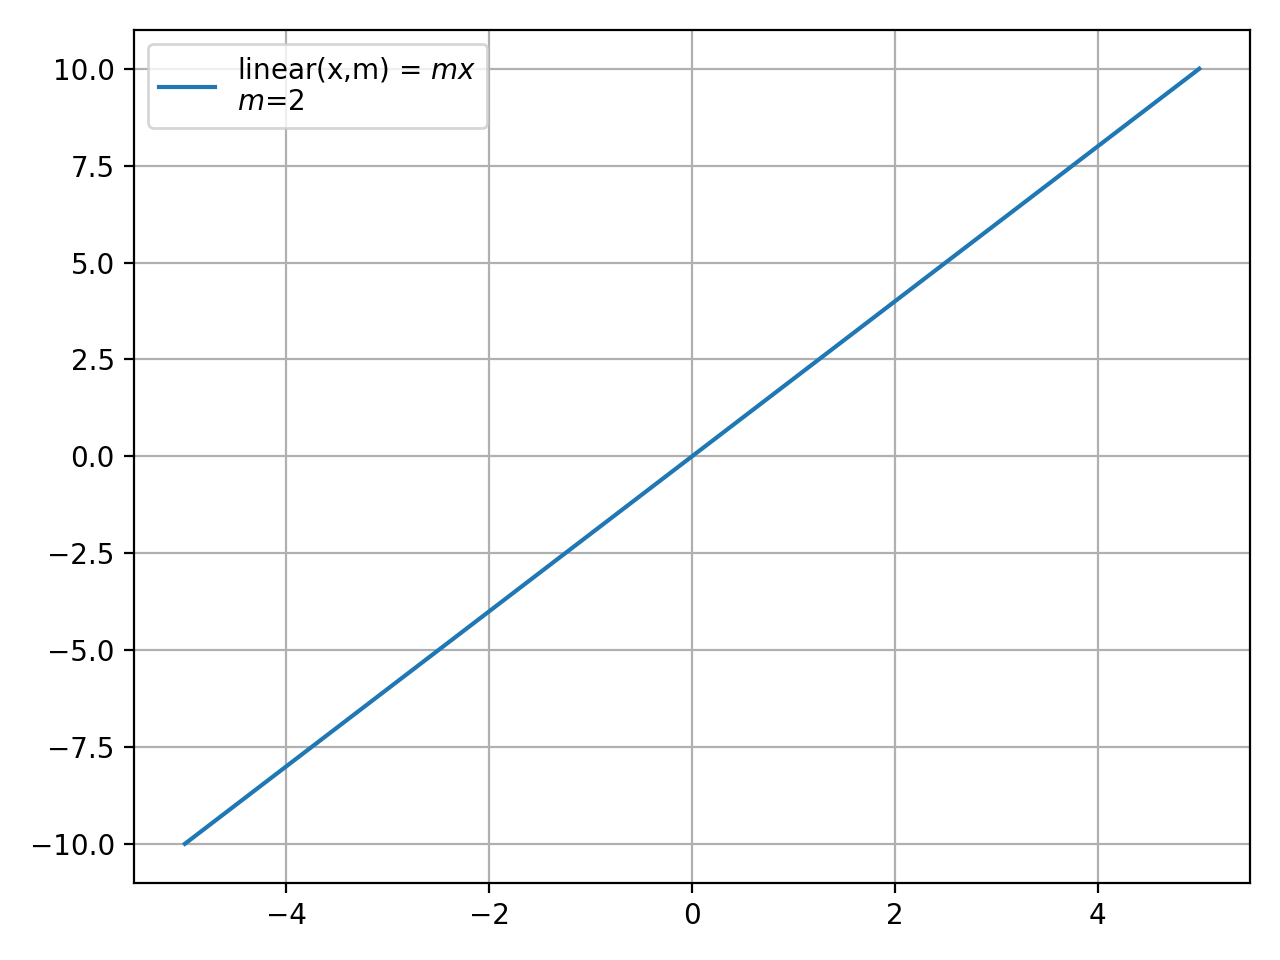
- smpl.functions.linear(x, m)[source]
linear(x,m) = \(m x\)
>>> from smpl.functions.functions import linear
>>> from smpl import plot
>>> plot.function(linear,2,xmin=-5,xmax=5)
(Source code, png, hires.png, pdf)

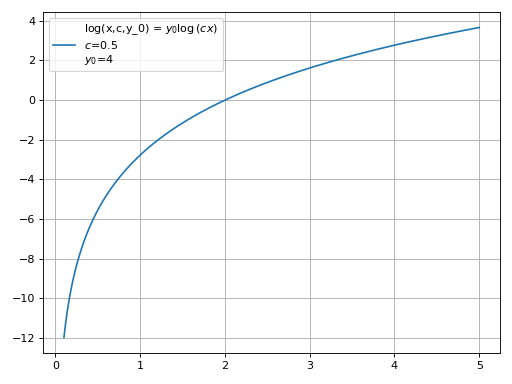
- smpl.functions.log(x, c, y_0)[source]
log(x,c,y_0) = \(y_{0} \log{\left(c x \right)}\)
>>> from smpl.functions.functions import log
>>> from smpl import plot
>>> plot.function(log,0.5,4,xmin=0.1,xmax=5)
(Source code, png, hires.png, pdf)

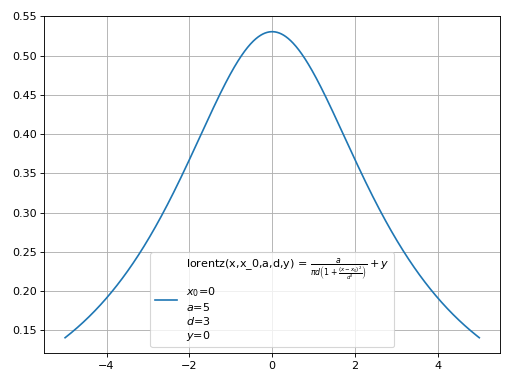
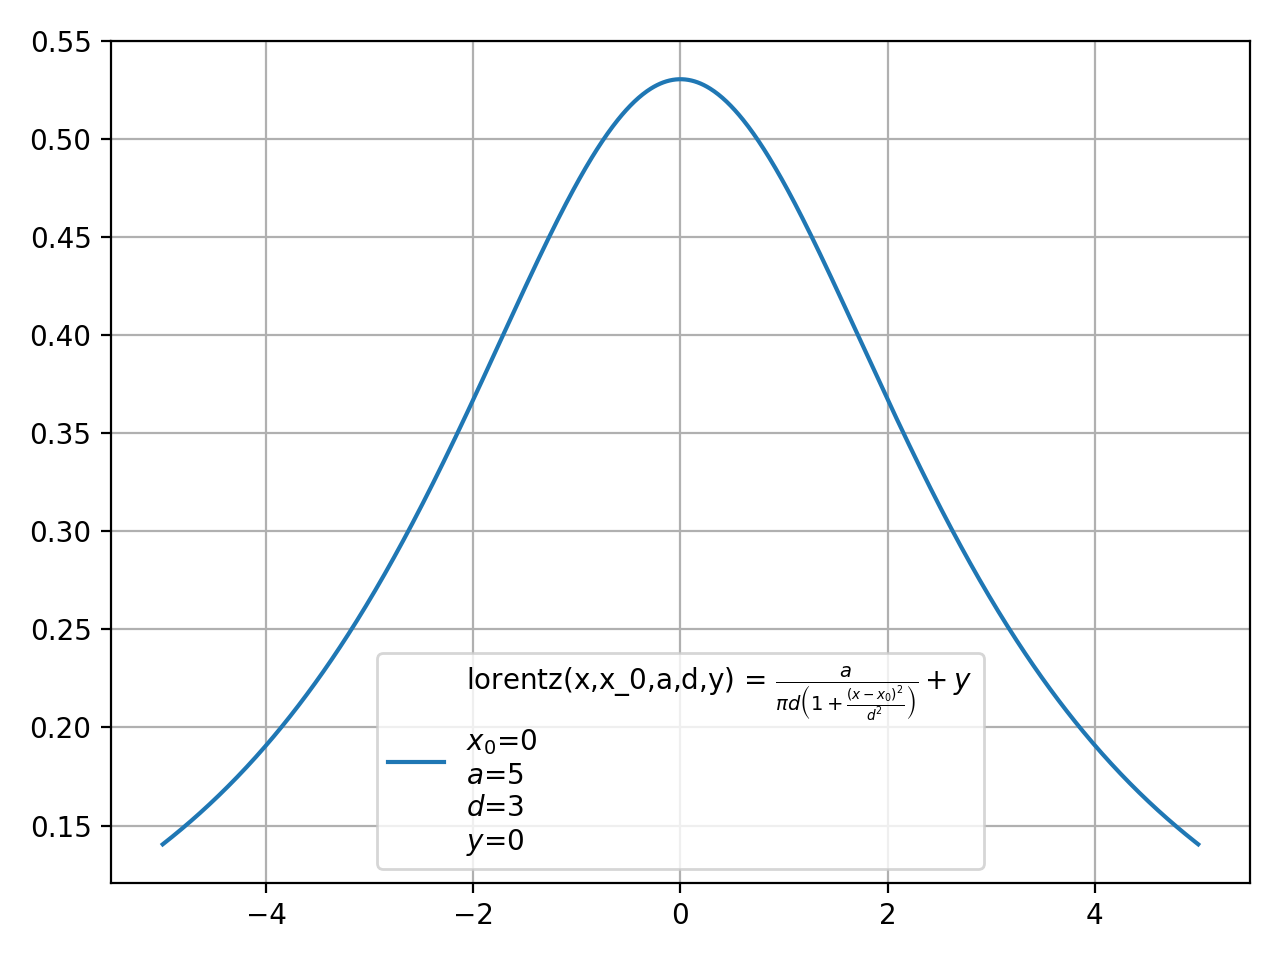
- smpl.functions.lorentz(x, x_0, a, d, y)[source]
lorentz(x,x_0,a,d,y) = \(\frac{a}{\pi d \left(1 + \frac{\left(x - x_{0}\right)^{2}}{d^{2}}\right)} + y\)
>>> from smpl.functions.functions import lorentz
>>> from smpl import plot
>>> plot.function(lorentz,0,5,3,0,xmin=-5,xmax=5)
(Source code, png, hires.png, pdf)
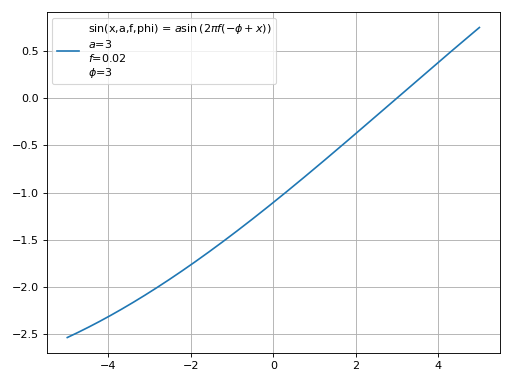
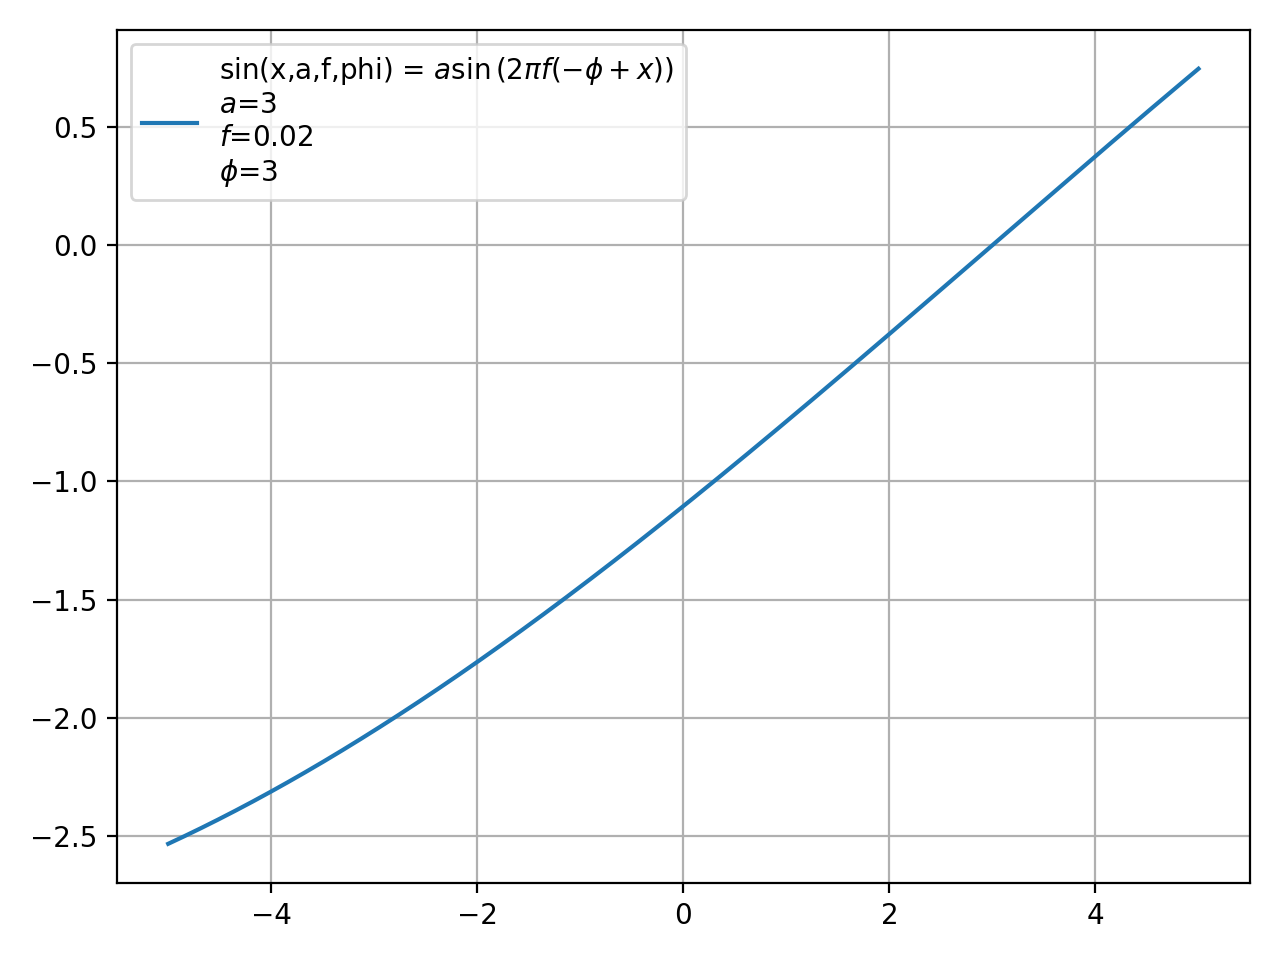
- smpl.functions.sin(x, a, f, phi)[source]
sin(x,a,f,phi) = \(a \sin{\left(2 \pi f \left(- \phi + x\right) \right)}\)
>>> from smpl.functions.functions import sin
>>> from smpl import plot
>>> plot.function(sin,3,0.02,3,xmin=-5,xmax=5)
(Source code, png, hires.png, pdf)
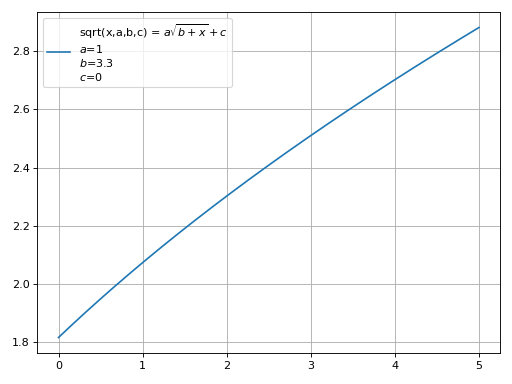
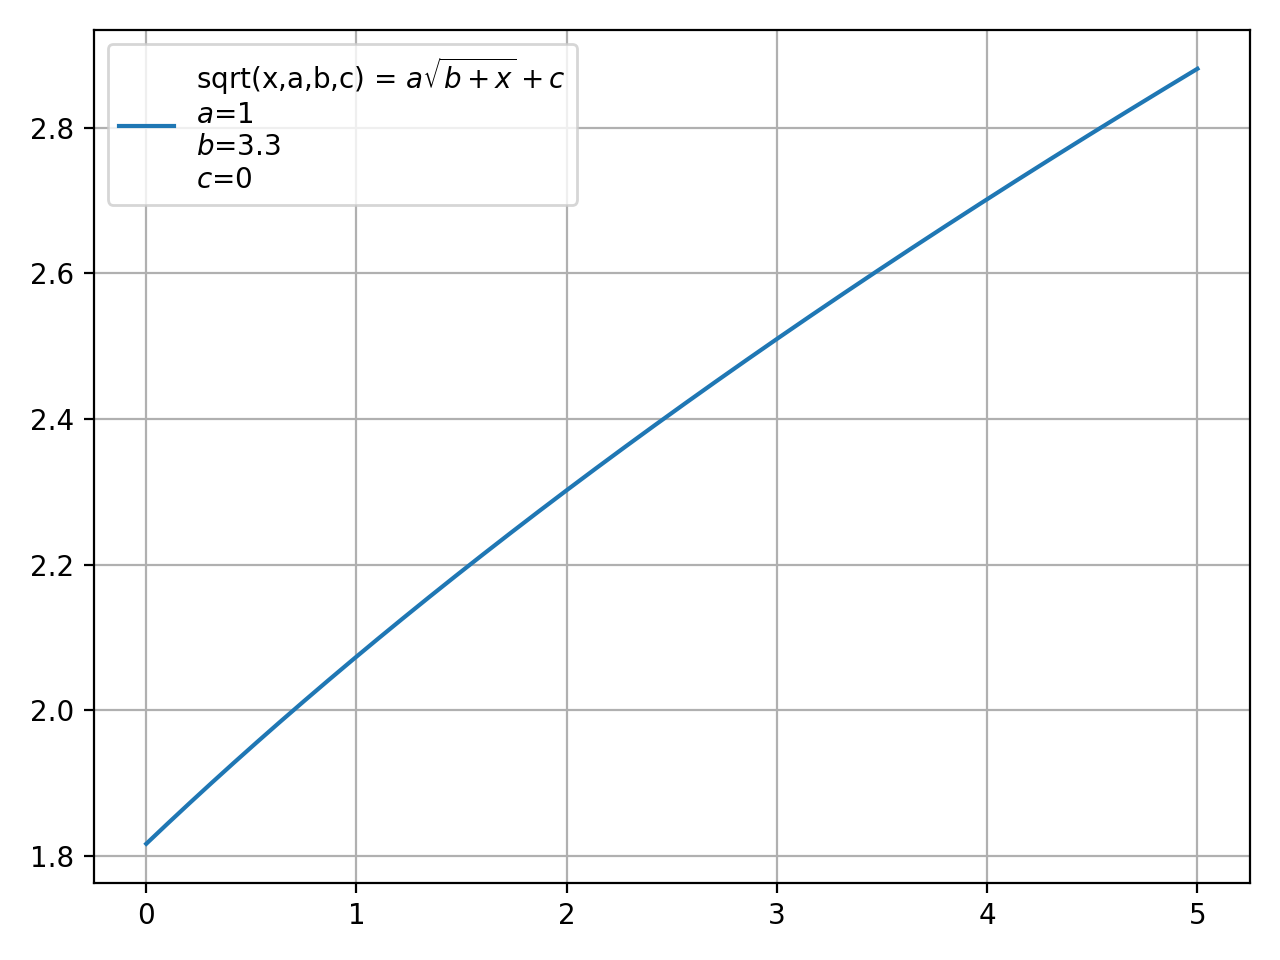
- smpl.functions.sqrt(x, a, b, c)[source]
sqrt(x,a,b,c) = \(a \sqrt{b + x} + c\)
>>> from smpl.functions.functions import sqrt
>>> from smpl import plot
>>> plot.function(sqrt,1,3.3,0,xmin=0,xmax=5)
(Source code, png, hires.png, pdf)