smpl.plot
Simplified plotting.
|
Plot the autocorrelation of x. |
|
Plot the angle spectrum. |
|
Annotate the point xy with text text. |
|
Add an arrow to the Axes. |
|
Automatically loop over functions and fit the best one. |
|
Autoscale the axis view to the data (toggle). |
|
Set the colormap to 'autumn'. |
|
Add an axes to the current figure and make it the current axes. |
|
Add a horizontal line across the Axes. |
|
Add a horizontal span (rectangle) across the Axes. |
|
Convenience method to get or set some axis properties. |
|
Add an infinitely long straight line. |
|
Add a vertical line across the Axes. |
|
Add a vertical span (rectangle) across the Axes. |
|
Make a bar plot. |
|
Label a bar plot. |
|
Plot a 2D field of barbs. |
|
Make a horizontal bar plot. |
|
Set the colormap to 'bone'. |
|
Turn the axes box on or off on the current axes. |
|
Draw a box and whisker plot. |
|
Plot a horizontal sequence of rectangles. |
|
Clear the current axes. |
|
Label a contour plot. |
|
Clear the current figure. |
|
Set the color limits of the current image. |
|
Close a figure window. |
|
Plot the coherence between x and y. |
|
Add a colorbar to a plot. |
|
Bind function func to event s. |
|
Plot contour lines. |
|
Plot filled contours. |
|
Set the colormap to 'cool'. |
|
Set the colormap to 'copper'. |
|
Plot the cross-spectral density. |
|
Create a new Cycler object from a single positional argument, a pair of positional arguments, or the combination of keyword arguments. |
|
Plot datay against datax via |
|
Remove an ~.axes.Axes (defaulting to the current axes) from its figure. |
|
Disconnect the callback with id cid. |
|
Redraw the current figure. |
|
Redraw all stale managed figures, or, if force is True, all managed figures. |
|
Redraw the current figure if in interactive mode. |
|
Plot y versus x as lines and/or markers with attached errorbars. |
|
Plot identical parallel lines at the given positions. |
|
Calculate the width and height for a figure with a specified aspect ratio. |
|
Add a non-resampled image to the figure. |
|
Place a legend on the figure. |
|
Return whether the figure with the given id exists. |
|
Add text to figure. |
|
Create a new figure, or activate an existing figure. |
|
Plot filled polygons. |
|
Fill the area between two horizontal curves. |
|
Fill the area between two vertical curves. |
|
Find artist objects. |
|
Fit and plot function to datax and datay. |
|
Set the colormap to 'flag'. |
|
Plot function |
|
Get the current Axes. |
|
Get the current figure. |
|
Get the current colorable artist. |
|
Return the value of an .Artist's property, or print all of them. |
|
Return the name of the current backend. |
|
Get a colormap instance, defaulting to rc values if name is None. |
|
Return the figure manager of the current figure. |
|
Return a list of existing figure labels. |
|
Return a list of existing figure numbers. |
|
Get a sorted list of all of the plotting commands. |
|
Return the names of the available scales. |
|
Return the value of an .Artist's property, or print all of them. |
|
Blocking call to interact with a figure. |
|
Set the colormap to 'gray'. |
|
Configure the grid lines. |
|
Make a 2D hexagonal binning plot of points x, y. |
|
Plot a histogram. |
|
Make a 2D histogram plot. |
|
Plot horizontal lines at each y from xmin to xmax. |
|
Set the colormap to 'hot'. |
|
Set the colormap to 'hsv'. |
|
Read an image from a file into an array. |
|
Save an array as an image file. |
|
Display data as an image, i.e., on a 2D regular raster. |
|
Set the colormap to 'inferno'. |
|
Install a repl display hook so that any stale figure are automatically redrawn when control is returned to the repl. |
|
Set whether to redraw after every plotting command (e.g. |
|
Disable interactive mode. |
|
Enable interactive mode. |
|
Return whether plots are updated after every plotting command. |
|
Set the colormap to 'jet'. |
|
Place a legend on the Axes. |
|
Control behavior of major tick locators. |
|
Make a plot with log scaling on both the x and y axis. |
|
Set the colormap to 'magma'. |
|
Plot the magnitude spectrum. |
|
Set or retrieve autoscaling margins. |
|
Display an array as a matrix in a new figure window. |
|
Remove minor ticks from the Axes. |
|
Display minor ticks on the Axes. |
|
Create a new figure manager instance. |
|
Set the colormap to 'nipy_spectral'. |
|
Run the GUI event loop for interval seconds. |
|
Create a pseudocolor plot with a non-regular rectangular grid. |
|
Create a pseudocolor plot with a non-regular rectangular grid. |
|
Plot the phase spectrum. |
|
Plot a pie chart. |
|
Set the colormap to 'pink'. |
|
Set the colormap to 'plasma'. |
|
Plot y versus x as lines and/or markers. |
|
Creates a 2D-Plot. |
|
Set default plot2d_kwargs if not set. |
|
Plot coercing the axis to treat floats as dates. |
|
Set default plot_kwargs if not set. |
|
|
|
Make a polar plot. |
|
Set the colormap to 'prism'. |
|
Plot the power spectral density. |
|
Plot a 2D field of arrows. |
|
Add a key to a quiver plot. |
|
Set the current .rcParams. group is the grouping for the rc, e.g., for |
|
Return a context manager for temporarily changing rcParams. |
|
Restore the .rcParams from Matplotlib's internal default style. |
|
Add a colormap to the set recognized by |
|
Get or set the radial gridlines on the current polar plot. |
|
Save the current figure. |
|
Set the current Axes to ax and the current Figure to the parent of ax. |
|
A scatter plot of y vs. |
|
Set the current image. |
|
Make a plot with log scaling on the x axis. |
|
Make a plot with log scaling on the y axis. |
|
Set the default colormap, and applies it to the current image if any. |
|
Set Matplotlib's root logger and root logger handler level, creating the handler if it does not exist yet. |
|
Set one or more properties on an .Artist, or list allowed values. |
|
Display all open figures. |
|
Plot a spectrogram. |
|
Set the colormap to 'spring'. |
|
Plot the sparsity pattern of a 2D array. |
|
Draw a stacked area plot. |
|
A stepwise constant function as a line with bounding edges or a filled plot. |
|
Create a stem plot. |
|
Make a step plot. |
|
Draw streamlines of a vector flow. |
|
Add an Axes to the current figure or retrieve an existing Axes. |
|
Create a subplot at a specific location inside a regular grid. |
|
Build a layout of Axes based on ASCII art or nested lists. |
|
Launch a subplot tool window for a figure. |
|
Create a figure and a set of subplots. |
|
Adjust the subplot layout parameters. |
|
Set the colormap to 'summer'. |
|
Add a centered suptitle to the figure. |
|
Close all open figures and set the Matplotlib backend. |
|
Add a table to an ~.axes.Axes. |
|
Add text to the Axes. |
|
Get or set the theta gridlines on the current polar plot. |
|
Change the appearance of ticks, tick labels, and gridlines. |
|
Configure the .ScalarFormatter used by default for linear axes. |
|
Adjust the padding between and around subplots. |
|
Set a title for the Axes. |
|
Draw contour lines on an unstructured triangular grid. |
|
Draw contour regions on an unstructured triangular grid. |
|
Create a pseudocolor plot of an unstructured triangular grid. |
|
Draw a unstructured triangular grid as lines and/or markers. |
|
Make and return a second axes that shares the x-axis. |
|
Make and return a second axes that shares the y-axis. |
|
Uninstall the Matplotlib display hook. |
|
Return the nominal values of the numbers in NumPy array arr. |
|
Return the standard deviations of the numbers in NumPy array arr. |
|
Make a violin plot. |
|
Set the colormap to 'viridis'. |
|
Plot vertical lines at each x from ymin to ymax. |
|
Blocking call to interact with the figure. |
|
Set the colormap to 'winter'. |
|
Plot the cross correlation between x and y. |
|
Turn on xkcd sketch-style drawing mode. |
|
Set the label for the x-axis. |
|
Get or set the x limits of the current axes. |
|
Set the x-axis scale. |
|
Get or set the current tick locations and labels of the x-axis. |
|
Set the label for the y-axis. |
|
Get or set the y-limits of the current axes. |
|
Set the y-axis scale. |
|
Get or set the current tick locations and labels of the y-axis. |
Functions
- smpl.plot.auto(datax, datay, funcs=None, **kwargs)[source]
Automatically loop over functions and fit the best one.
- Parameters
- funcsfunction array
functions to consider as fit. Default all
smpl.functions.- **kwargsoptional
see
plot_kwargs().
- Returns
- The best fit function and it’s parameters. Also a lambda function where the parameters are already applied.
- smpl.plot.data(datax, datay, function=None, **kwargs)[source]
Plot datay against datax via
fit()- Parameters
- dataxarray_like
X data either as
unp.uarrayornp.arrayorlist- datayarray_like
Y data either as
unp.uarrayornp.arrayorlist- functionfunc,optional
Fit function with parameters:
x,params- **kwargsoptional
see
plot_kwargs().- Returns
- ——-
- array_like
Optimized fit parameters of
functiontodataxanddatay
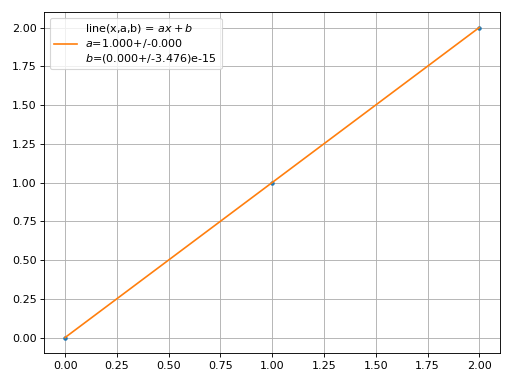
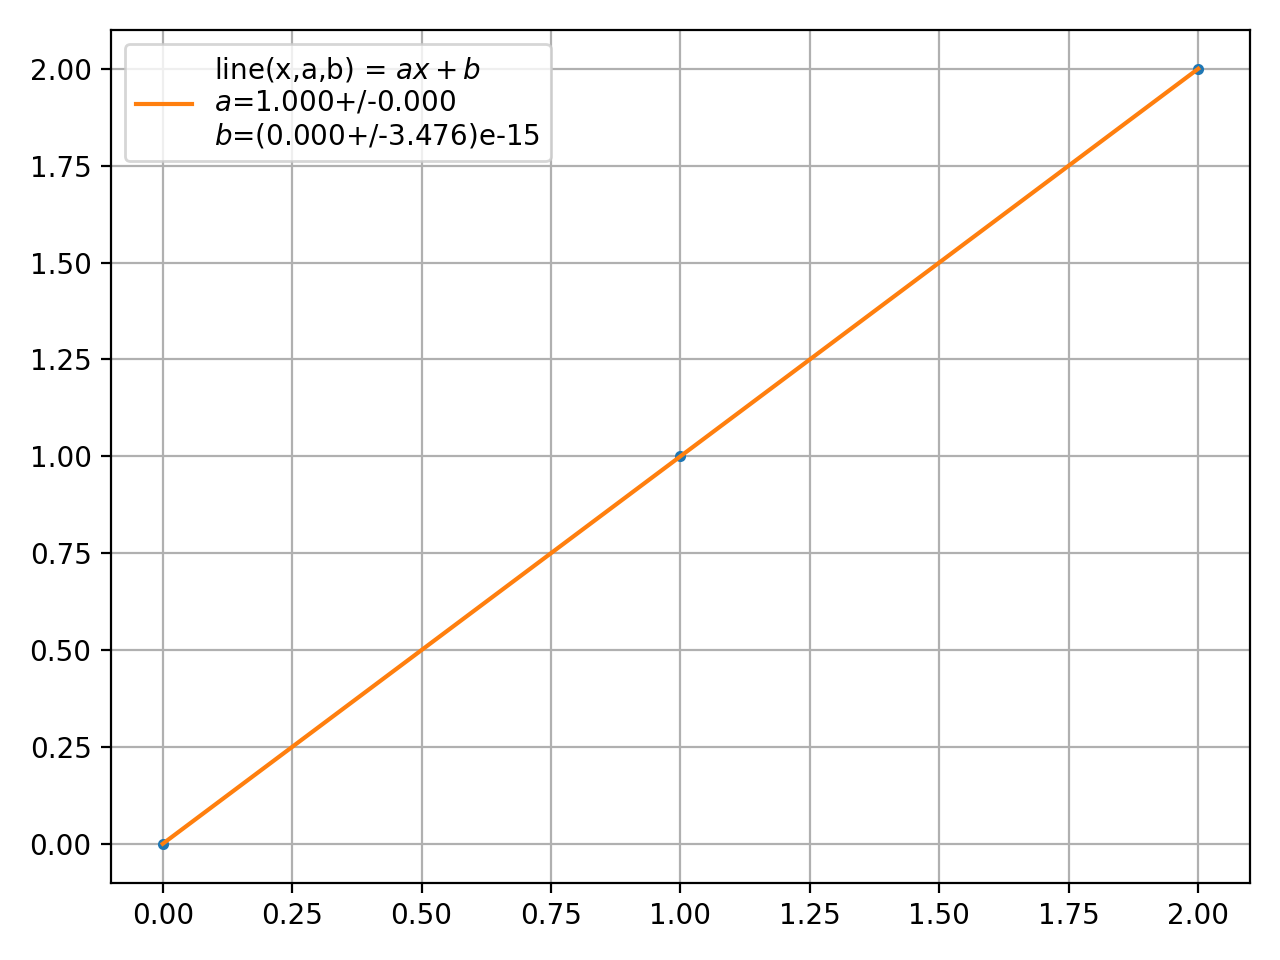
- smpl.plot.fit(datax, datay, function, **kwargs)[source]
Fit and plot function to datax and datay.
- Parameters
- dataxarray_like
X data either as
unp.uarrayornp.arrayorlist- datayarray_like
Y data either as
unp.uarrayornp.arrayorlist- functionfunc
Fit function with parameters:
x,params- **kwargsoptional
see
plot_kwargs().- Fit parameters can be fixed via ``kwargs`` eg. ``a=5``.
- Returns
- array_like
Optimized fit parameters of
functiontodataxanddatay
Examples
>>> from smpl import functions as f
>>> from smpl import plot
>>> param = plot.fit([0,1,2],[0,1,2],f.line)
>>> plot.unv(param).round()[0]
1.0
(Source code, png, hires.png, pdf)
- smpl.plot.function(func, *args, **kwargs)[source]
Plot function
funcbetweenxminandxmax- Parameters
- funcfunction
Function to be plotted between
xminandxmax, only taking array_likexas parameter- *argsoptional
arguments for
func- **kwargsoptional
see
plot_kwargs().
- smpl.plot.plot2d(datax, datay, dataz, **kwargs)[source]
Creates a 2D-Plot.
- Parameters
- **kwargsoptional
see
plot2d_kwargs().
- smpl.plot.plot2d_kwargs(kwargs)[source]
Set default plot2d_kwargs if not set.
plot2d_kwargs
default
description
xaxis
None
.
yaxis
None
.
zaxis
None
.
logz
True
Colorbar in logarithmic scale.
style
image
Plot via an image (‘image’) or scatter (‘scatter’).
interpolation
nearest
Only ‘nearest’ or ‘bilinear’ for nonuniformimage. Check https://matplotlib.org/stable/gallery/images_contours_and_fields/interpolation_methods.html#interpolations-for-imshow
cmap
viridis
Good default color map for missing datapoints since it does not include white.
- smpl.plot.plot_kwargs(kwargs)[source]
Set default plot_kwargs if not set.
plot_kwargs
default
description
xlabel
X axis label
ylabel
Y axis label
label
None
Legend name of plotted
datafmt
.
Format for plotting fit function
units
None
Units of the fit parameters as strings. Displayed in the Legend
save
None
File to save the plot
lpos
0
Legend position
tight
True
tight_layout
prange
None
Limit the plot of the fit to given range
sigmas
0
Color the array of given
sigmatimes uncertainty. Only works if the fit function is coded withunpdata_sigmas
1
Color the array of given
sigmatimes uncertainty. Only works if the data has uncertaintiesinit
False
Initialize a new plot
ss
True
save, add legends and grid to the plot
also_data
True
also plot the data
also_fit
True
also plot the fit
logy
False
logarithmic x axis
logx
False
logarithmic y axis
function_color
None
Color of the function plot
data_color
None
Color of the data plot
fit_color
None
Color of the fit plot
fit_fmt
Format of the fit plot
residue
False
Display difference between fit and data in a second plot
residue_err
True
Differences between fit and data will have errorbars
show
False
Call plt.show()
size
None
Size of the plot as a tuple (x,y). Only has an effect if
initis Truenumber_format
{0:.4g}
Format to display numbers.
interpolate
False
Enable interpolation of the data.
interpolate_fmt
Either format string or linestyle tuple.
extrapolate
True
Enable extrapolation of whole data if fit range is limited by
frangeorfselector.extrapolate_min
None
Lower extrapolation bound
extrapolate_max
None
Higher extrapolation bound
extrapolate_fmt
–
Format of the extrapolation line
extrapolate_hatch
||
Extrapolation shape/hatch for filled area in case of
sigmas>0. See https://matplotlib.org/stable/gallery/shapes_and_collections/hatch_style_reference.htmlbbox_to_anchor
None
Position in a tuple (x,y),Shift position of the legend out of the main pane.
ncol
None
Columns in the legend if used with
bbox_to_anchor.steps
1000
resolution of the plotted function
fitinline
False
No newlines for each fit parameter
grid
True
Enable grid for the plot
hist
False
Enable histogram plot
stairs
False
Enable stair plot
capsize
5
size of cap on error bar plot
axes
None
set current axis
linestyle
None
linestyle, only active if `fmt`=None
xspace
linspace
xspace gets called with xspace(xmin,xmax,steps) in
function()to get the points of the function that will be drawn.only_uncertainties
False
Only plot uncertainties for interpolation or fit
Set default fit_kwargs if not set.
fit_kwargs
default
description
params
None
Initial fit parameters
fixed_params
True
Enable fixing parameters by choosing the same-named variables from
kwargs.maxfev
10000
Maximum function evaluations during fitting.
epsfcn
0.0001
Suitable step length for jacobian approximation.
xvar
None
Variable in fit function parameters that corresponds to the x axis. If it is None the last of the alphabetical sorted parameters is used.
autotqdm
True
Auto fitting display tqdm
fitter
Fitter.AUTO
Choose from :class:`Fitter`s.
Set default data_kwargs if not set.
data_kwargs
default
description
frange
None
Limit the fit to given range. First integer is the lowest and second the highest index.
fselector
None
Function that takes
xandyas parameters and returns an array mask in order to limit the data points for fitting. Alternatively a mask for selecting elements from datax and datay.sortbyx
True
Enable sorting the x and y data so that x is sorted.
bins
0
Number of bins for histogram
binunc
poisson_dist
Number of bins for histogram
xerror
True
enable xerrors
yerror
True
enable yerrors
- smpl.plot.unv(arr)
Return the nominal values of the numbers in NumPy array arr.
Elements that are not numbers with uncertainties (derived from a class from this module) are passed through untouched (because a numpy.array can contain numbers with uncertainties and pure floats simultaneously).
If arr is of type unumpy.matrix, the returned array is a numpy.matrix, because the resulting matrix does not contain numbers with uncertainties.
- smpl.plot.usd(arr)
Return the standard deviations of the numbers in NumPy array arr.
Elements that are not numbers with uncertainties (derived from a class from this module) are passed through untouched (because a numpy.array can contain numbers with uncertainties and pure floats simultaneously).
If arr is of type unumpy.matrix, the returned array is a numpy.matrix, because the resulting matrix does not contain numbers with uncertainties.