smpl.plot.Axes
- class smpl.plot.Axes(fig, rect, *, facecolor=None, frameon=True, sharex=None, sharey=None, label='', xscale=None, yscale=None, box_aspect=None, **kwargs)[source]
Bases:
_AxesBaseThe Axes contains most of the figure elements: ~.axis.Axis, ~.axis.Tick, ~.lines.Line2D, ~.text.Text, ~.patches.Polygon, etc., and sets the coordinate system.
The Axes instance supports callbacks through a callbacks attribute which is a ~.cbook.CallbackRegistry instance. The events you can connect to are ‘xlim_changed’ and ‘ylim_changed’ and the callback will be called with func(ax) where ax is the Axes instance.
Attributes
- dataLim.Bbox
The bounding box enclosing all data displayed in the Axes.
- viewLim.Bbox
The view limits in data coordinates.
- __init__(fig, rect, *, facecolor=None, frameon=True, sharex=None, sharey=None, label='', xscale=None, yscale=None, box_aspect=None, **kwargs)
Build an Axes in a figure.
Parameters
- fig~matplotlib.figure.Figure
The Axes is built in the .Figure fig.
- recttuple (left, bottom, width, height).
The Axes is built in the rectangle rect. rect is in .Figure coordinates.
- sharex, sharey~.axes.Axes, optional
The x or y ~.matplotlib.axis is shared with the x or y axis in the input ~.axes.Axes.
- frameonbool, default: True
Whether the Axes frame is visible.
- box_aspectfloat, optional
Set a fixed aspect for the Axes box, i.e. the ratio of height to width. See ~.axes.Axes.set_box_aspect for details.
- **kwargs
Other optional keyword arguments:
Properties: adjustable: {‘box’, ‘datalim’} agg_filter: a filter function, which takes a (m, n, 3) float array and a dpi value, and returns a (m, n, 3) array and two offsets from the bottom left corner of the image alpha: scalar or None anchor: (float, float) or {‘C’, ‘SW’, ‘S’, ‘SE’, ‘E’, ‘NE’, …} animated: bool aspect: {‘auto’, ‘equal’} or float autoscale_on: bool autoscalex_on: unknown autoscaley_on: unknown axes_locator: Callable[[Axes, Renderer], Bbox] axisbelow: bool or ‘line’ box_aspect: float or None clip_box: .Bbox clip_on: bool clip_path: Patch or (Path, Transform) or None facecolor or fc: color figure: .Figure frame_on: bool gid: str in_layout: bool label: object mouseover: bool navigate: bool navigate_mode: unknown path_effects: .AbstractPathEffect picker: None or bool or float or callable position: [left, bottom, width, height] or ~matplotlib.transforms.Bbox prop_cycle: unknown rasterization_zorder: float or None rasterized: bool sketch_params: (scale: float, length: float, randomness: float) snap: bool or None title: str transform: .Transform url: str visible: bool xbound: unknown xlabel: str xlim: (bottom: float, top: float) xmargin: float greater than -0.5 xscale: unknown xticklabels: unknown xticks: unknown ybound: unknown ylabel: str ylim: (bottom: float, top: float) ymargin: float greater than -0.5 yscale: unknown yticklabels: unknown yticks: unknown zorder: float
Returns
- ~.axes.Axes
The new ~.axes.Axes object.
Methods
__init__(fig, rect, *[, facecolor, frameon, ...])Build an Axes in a figure.
acorr(x, *[, data])Plot the autocorrelation of x.
add_artist(a)Add an .Artist to the Axes; return the artist.
add_callback(func)Add a callback function that will be called whenever one of the .Artist's properties changes.
add_child_axes(ax)Add an .AxesBase to the Axes' children; return the child Axes.
add_collection(collection[, autolim])Add a .Collection to the Axes; return the collection.
add_container(container)Add a .Container to the Axes' containers; return the container.
add_image(image)Add an .AxesImage to the Axes; return the image.
add_line(line)Add a .Line2D to the Axes; return the line.
add_patch(p)Add a .Patch to the Axes; return the patch.
add_table(tab)Add a .Table to the Axes; return the table.
angle_spectrum(x[, Fs, Fc, window, pad_to, ...])Plot the angle spectrum.
annotate(text, xy[, xytext, xycoords, ...])Annotate the point xy with text text.
apply_aspect([position])Adjust the Axes for a specified data aspect ratio.
arrow(x, y, dx, dy, **kwargs)Add an arrow to the Axes.
autoscale([enable, axis, tight])Autoscale the axis view to the data (toggle).
autoscale_view([tight, scalex, scaley])Autoscale the view limits using the data limits.
axhline([y, xmin, xmax])Add a horizontal line across the Axes.
axhspan(ymin, ymax[, xmin, xmax])Add a horizontal span (rectangle) across the Axes.
axis(*args[, emit])Convenience method to get or set some axis properties.
axline(xy1[, xy2, slope])Add an infinitely long straight line.
axvline([x, ymin, ymax])Add a vertical line across the Axes.
axvspan(xmin, xmax[, ymin, ymax])Add a vertical span (rectangle) across the Axes.
bar(x, height[, width, bottom, align, data])Make a bar plot.
bar_label(container[, labels, fmt, ...])Label a bar plot.
barbs(*args[, data])Plot a 2D field of barbs.
barh(y, width[, height, left, align, data])Make a horizontal bar plot.
boxplot(x[, notch, sym, vert, whis, ...])Draw a box and whisker plot.
broken_barh(xranges, yrange, *[, data])Plot a horizontal sequence of rectangles.
bxp(bxpstats[, positions, widths, vert, ...])Drawing function for box and whisker plots.
can_pan()Return whether this Axes supports any pan/zoom button functionality.
can_zoom()Return whether this Axes supports the zoom box button functionality.
cla()Clear the Axes.
clabel(CS[, levels])Label a contour plot.
clear()Clear the Axes.
cohere(x, y[, NFFT, Fs, Fc, detrend, ...])Plot the coherence between x and y.
contains(mouseevent)Test whether the artist contains the mouse event.
contains_point(point)Return whether point (pair of pixel coordinates) is inside the Axes patch.
contour(*args[, data])Plot contour lines.
contourf(*args[, data])Plot filled contours.
Convert x using the unit type of the xaxis.
Convert y using the unit type of the yaxis.
csd(x, y[, NFFT, Fs, Fc, detrend, window, ...])Plot the cross-spectral density.
drag_pan(button, key, x, y)Called when the mouse moves during a pan operation.
draw(renderer)Draw the Artist (and its children) using the given renderer.
draw_artist(a)Efficiently redraw a single artist.
end_pan()Called when a pan operation completes (when the mouse button is up.)
errorbar(x, y[, yerr, xerr, fmt, ecolor, ...])Plot y versus x as lines and/or markers with attached errorbars.
eventplot(positions[, orientation, ...])Plot identical parallel lines at the given positions.
fill(*args[, data])Plot filled polygons.
fill_between(x, y1[, y2, where, ...])Fill the area between two horizontal curves.
fill_betweenx(y, x1[, x2, where, step, ...])Fill the area between two vertical curves.
findobj([match, include_self])Find artist objects.
format_coord(x, y)Return a format string formatting the x, y coordinates.
format_cursor_data(data)Return a string representation of data.
format_xdata(x)Return x formatted as an x-value.
format_ydata(y)Return y formatted as an y-value.
Return whether the Axes will adjust its physical dimension ('box') or its data limits ('datalim') to achieve the desired aspect ratio.
Return filter function to be used for agg filter.
Return the alpha value used for blending - not supported on all backends.
Get the anchor location.
Return whether the artist is animated.
Return the aspect ratio of the axes scaling.
Return True if each axis is autoscaled, False otherwise.
Return whether the xaxis is autoscaled.
Return whether the yaxis is autoscaled.
Return the axes_locator.
Get whether axis ticks and gridlines are above or below most artists.
Return the Axes box aspect, i.e. the ratio of height to width.
Return a list of the child .Artists of this .Artist.
Return the clipbox.
Return whether the artist uses clipping.
Return the clip path.
get_cursor_data(event)Return the cursor data for a given event.
Return the aspect ratio of the scaled data.
Return a default list of artists that are used for the bounding box calculation.
Get the facecolor of the Axes.
get_fc()Alias for get_facecolor.
Return the .Figure instance the artist belongs to.
Get whether the Axes rectangle patch is drawn.
get_gid()Return the group id.
Return a list of .AxesImages contained by the Axes.
Return boolean flag,
Trueif artist is included in layout calculations.Return the label used for this artist in the legend.
Return the .Legend instance, or None if no legend is defined.
get_legend_handles_labels([legend_handler_map])Return handles and labels for legend
Return a list of lines contained by the Axes.
Return whether this artist is queried for custom context information when the mouse cursor moves over it.
Get whether the Axes responds to navigation commands.
Get the navigation toolbar button status: 'PAN', 'ZOOM', or None.
get_path_effects()Return the picking behavior of the artist.
get_position([original])Return the position of the Axes within the figure as a .Bbox.
Return the zorder value below which artists will be rasterized.
Return whether the artist is to be rasterized.
[Deprecated]
Return an immutable view on the shared x-axes Grouper.
Return an immutable view on the shared y-axes Grouper.
Return the sketch parameters for the artist.
get_snap()Return the snap setting.
get_tightbbox([renderer, call_axes_locator, ...])Return the tight bounding box of the Axes, including axis and their decorators (xlabel, title, etc).
get_title([loc])Get an Axes title.
Return the .Transform instance used by this artist.
Return the clip path with the non-affine part of its transformation applied, and the remaining affine part of its transformation.
get_url()Return the url.
Return the visibility.
get_window_extent([renderer])Return the Axes bounding box in display space; args and kwargs are empty.
[Discouraged] Return the XAxis instance.
get_xaxis_text1_transform(pad_points)Returns transform Transform The transform used for drawing x-axis labels, which will add pad_points of padding (in points) between the axis and the label. The x-direction is in data coordinates and the y-direction is in axis coordinates valign {'center', 'top', 'bottom', 'baseline', 'center_baseline'} The text vertical alignment. halign {'center', 'left', 'right'} The text horizontal alignment.
get_xaxis_text2_transform(pad_points)Returns transform Transform The transform used for drawing secondary x-axis labels, which will add pad_points of padding (in points) between the axis and the label. The x-direction is in data coordinates and the y-direction is in axis coordinates valign {'center', 'top', 'bottom', 'baseline', 'center_baseline'} The text vertical alignment. halign {'center', 'left', 'right'} The text horizontal alignment.
get_xaxis_transform([which])Get the transformation used for drawing x-axis labels, ticks and gridlines.
Return the lower and upper x-axis bounds, in increasing order.
Return the xaxis' grid lines as a list of .Line2Ds.
Get the xlabel text string.
get_xlim()Return the x-axis view limits.
Return the xaxis' major tick labels, as a list of ~.text.Text.
Return the xaxis' minor tick labels, as a list of ~.text.Text.
Return the xaxis' scale (as a str).
get_xticklabels([minor, which])Get the xaxis' tick labels.
get_xticklines([minor])Return the xaxis' tick lines as a list of .Line2Ds.
get_xticks(*[, minor])Return the xaxis' tick locations in data coordinates.
[Discouraged] Return the YAxis instance.
get_yaxis_text1_transform(pad_points)Returns transform Transform The transform used for drawing y-axis labels, which will add pad_points of padding (in points) between the axis and the label. The x-direction is in axis coordinates and the y-direction is in data coordinates valign {'center', 'top', 'bottom', 'baseline', 'center_baseline'} The text vertical alignment. halign {'center', 'left', 'right'} The text horizontal alignment.
get_yaxis_text2_transform(pad_points)Returns transform Transform The transform used for drawing secondart y-axis labels, which will add pad_points of padding (in points) between the axis and the label. The x-direction is in axis coordinates and the y-direction is in data coordinates valign {'center', 'top', 'bottom', 'baseline', 'center_baseline'} The text vertical alignment. halign {'center', 'left', 'right'} The text horizontal alignment.
get_yaxis_transform([which])Get the transformation used for drawing y-axis labels, ticks and gridlines.
Return the lower and upper y-axis bounds, in increasing order.
Return the yaxis' grid lines as a list of .Line2Ds.
Get the ylabel text string.
get_ylim()Return the y-axis view limits.
Return the yaxis' major tick labels, as a list of ~.text.Text.
Return the yaxis' minor tick labels, as a list of ~.text.Text.
Return the yaxis' scale (as a str).
get_yticklabels([minor, which])Get the yaxis' tick labels.
get_yticklines([minor])Return the yaxis' tick lines as a list of .Line2Ds.
get_yticks(*[, minor])Return the yaxis' tick locations in data coordinates.
Return the artist's zorder.
grid([visible, which, axis])Configure the grid lines.
has_data()Return whether any artists have been added to the Axes.
Return whether units are set on any axis.
hexbin(x, y[, C, gridsize, bins, xscale, ...])Make a 2D hexagonal binning plot of points x, y.
hist(x[, bins, range, density, weights, ...])Compute and plot a histogram.
hist2d(x, y[, bins, range, density, ...])Make a 2D histogram plot.
hlines(y, xmin, xmax[, colors, linestyles, ...])Plot horizontal lines at each y from xmin to xmax.
imshow(X[, cmap, norm, aspect, ...])Display data as an image, i.e., on a 2D regular raster.
in_axes(mouseevent)Return whether the given event (in display coords) is in the Axes.
indicate_inset(bounds[, inset_ax, ...])Add an inset indicator to the Axes.
indicate_inset_zoom(inset_ax, **kwargs)Add an inset indicator rectangle to the Axes based on the axis limits for an inset_ax and draw connectors between inset_ax and the rectangle.
inset_axes(bounds, *[, transform, zorder])Add a child inset Axes to this existing Axes.
Invert the x-axis.
Invert the y-axis.
Return whether the Artist has an explicitly set transform.
legend(*args, **kwargs)Place a legend on the Axes.
locator_params([axis, tight])Control behavior of major tick locators.
loglog(*args, **kwargs)Make a plot with log scaling on both the x and y axis.
magnitude_spectrum(x[, Fs, Fc, window, ...])Plot the magnitude spectrum.
margins(*margins[, x, y, tight])Set or retrieve autoscaling margins.
matshow(Z, **kwargs)Plot the values of a 2D matrix or array as color-coded image.
Remove minor ticks from the Axes.
Display minor ticks on the Axes.
pchanged()Call all of the registered callbacks.
pcolor(*args[, shading, alpha, norm, cmap, ...])Create a pseudocolor plot with a non-regular rectangular grid.
pcolorfast(*args[, alpha, norm, cmap, vmin, ...])Create a pseudocolor plot with a non-regular rectangular grid.
pcolormesh(*args[, alpha, norm, cmap, vmin, ...])Create a pseudocolor plot with a non-regular rectangular grid.
phase_spectrum(x[, Fs, Fc, window, pad_to, ...])Plot the phase spectrum.
pick(mouseevent)Process a pick event.
pickable()Return whether the artist is pickable.
pie(x[, explode, labels, colors, autopct, ...])Plot a pie chart.
plot(*args[, scalex, scaley, data])Plot y versus x as lines and/or markers.
plot_date(x, y[, fmt, tz, xdate, ydate, data])[Discouraged] Plot coercing the axis to treat floats as dates.
Return a dictionary of all the properties of the artist.
psd(x[, NFFT, Fs, Fc, detrend, window, ...])Plot the power spectral density.
quiver(*args[, data])Plot a 2D field of arrows.
quiverkey(Q, X, Y, U, label, **kwargs)Add a key to a quiver plot.
Efficiently redraw Axes data, but not axis ticks, labels, etc.
relim([visible_only])Recompute the data limits based on current artists.
remove()Remove the artist from the figure if possible.
remove_callback(oid)Remove a callback based on its observer id.
Reset the active position to the original position.
scatter(x, y[, s, c, marker, cmap, norm, ...])A scatter plot of y vs.
secondary_xaxis(location, *[, functions])Add a second x-axis to this Axes.
secondary_yaxis(location, *[, functions])Add a second y-axis to this Axes.
semilogx(*args, **kwargs)Make a plot with log scaling on the x axis.
semilogy(*args, **kwargs)Make a plot with log scaling on the y axis.
set(*[, adjustable, agg_filter, alpha, ...])Set multiple properties at once.
set_adjustable(adjustable[, share])Set how the Axes adjusts to achieve the required aspect ratio.
set_agg_filter(filter_func)Set the agg filter.
set_alpha(alpha)Set the alpha value used for blending - not supported on all backends.
set_anchor(anchor[, share])Define the anchor location.
set_animated(b)Set whether the artist is intended to be used in an animation.
set_aspect(aspect[, adjustable, anchor, share])Set the aspect ratio of the axes scaling, i.e. y/x-scale.
Set whether autoscaling is applied to each axis on the next draw or call to .Axes.autoscale_view.
Set whether the xaxis is autoscaled when drawing or by .Axes.autoscale_view.
Set whether the yaxis is autoscaled when drawing or by .Axes.autoscale_view.
set_axes_locator(locator)Set the Axes locator.
Turn the x- and y-axis off.
Turn the x- and y-axis on.
Set whether axis ticks and gridlines are above or below most artists.
set_box_aspect([aspect])Set the Axes box aspect, i.e. the ratio of height to width.
set_clip_box(clipbox)Set the artist's clip .Bbox.
set_clip_on(b)Set whether the artist uses clipping.
set_clip_path(path[, transform])Set the artist's clip path.
set_facecolor(color)Set the facecolor of the Axes.
set_fc(color)Alias for set_facecolor.
set_figure(fig)Set the .Figure instance the artist belongs to.
set_frame_on(b)Set whether the Axes rectangle patch is drawn.
set_gid(gid)Set the (group) id for the artist.
set_in_layout(in_layout)Set if artist is to be included in layout calculations, E.g.
set_label(s)Set a label that will be displayed in the legend.
set_mouseover(mouseover)Set whether this artist is queried for custom context information when the mouse cursor moves over it.
set_navigate(b)Set whether the Axes responds to navigation toolbar commands.
Set the navigation toolbar button status.
set_path_effects(path_effects)Set the path effects.
set_picker(picker)Define the picking behavior of the artist.
set_position(pos[, which])Set the Axes position.
set_prop_cycle(*args, **kwargs)Set the property cycle of the Axes.
Set the zorder threshold for rasterization for vector graphics output.
set_rasterized(rasterized)Force rasterized (bitmap) drawing for vector graphics output.
set_sketch_params([scale, length, randomness])Set the sketch parameters.
set_snap(snap)Set the snapping behavior.
set_title(label[, fontdict, loc, pad, y])Set a title for the Axes.
Set the artist transform.
set_url(url)Set the url for the artist.
set_visible(b)Set the artist's visibility.
set_xbound([lower, upper])Set the lower and upper numerical bounds of the x-axis.
set_xlabel(xlabel[, fontdict, labelpad, loc])Set the label for the x-axis.
set_xlim([left, right, emit, auto, xmin, xmax])Set the x-axis view limits.
set_xmargin(m)Set padding of X data limits prior to autoscaling.
set_xscale(value, **kwargs)Set the xaxis' scale.
set_xticklabels(labels, *[, fontdict, minor])Set the xaxis' labels with list of string labels.
set_xticks(ticks[, labels, minor])Set the xaxis' tick locations and optionally labels.
set_ybound([lower, upper])Set the lower and upper numerical bounds of the y-axis.
set_ylabel(ylabel[, fontdict, labelpad, loc])Set the label for the y-axis.
set_ylim([bottom, top, emit, auto, ymin, ymax])Set the y-axis view limits.
set_ymargin(m)Set padding of Y data limits prior to autoscaling.
set_yscale(value, **kwargs)Set the yaxis' scale.
set_yticklabels(labels, *[, fontdict, minor])Set the yaxis' labels with list of string labels.
set_yticks(ticks[, labels, minor])Set the yaxis' tick locations and optionally labels.
set_zorder(level)Set the zorder for the artist.
sharex(other)Share the x-axis with other.
sharey(other)Share the y-axis with other.
specgram(x[, NFFT, Fs, Fc, detrend, window, ...])Plot a spectrogram.
spy(Z[, precision, marker, markersize, ...])Plot the sparsity pattern of a 2D array.
stackplot(x, *args[, labels, colors, ...])Draw a stacked area plot.
stairs(values[, edges, orientation, ...])A stepwise constant function as a line with bounding edges or a filled plot.
start_pan(x, y, button)Called when a pan operation has started.
stem(*args[, linefmt, markerfmt, basefmt, ...])Create a stem plot.
step(x, y, *args[, where, data])Make a step plot.
streamplot(x, y, u, v[, density, linewidth, ...])Draw streamlines of a vector flow.
table([cellText, cellColours, cellLoc, ...])Add a table to an ~.axes.Axes.
text(x, y, s[, fontdict])Add text to the Axes.
tick_params([axis])Change the appearance of ticks, tick labels, and gridlines.
ticklabel_format(*[, axis, style, ...])Configure the .ScalarFormatter used by default for linear Axes.
tricontour(*args, **kwargs)Draw contour lines on an unstructured triangular grid.
tricontourf(*args, **kwargs)Draw contour regions on an unstructured triangular grid.
tripcolor(*args[, alpha, norm, cmap, vmin, ...])Create a pseudocolor plot of an unstructured triangular grid.
triplot(*args, **kwargs)Draw an unstructured triangular grid as lines and/or markers.
twinx()Create a twin Axes sharing the xaxis.
twiny()Create a twin Axes sharing the yaxis.
update(props)Update this artist's properties from the dict props.
update_datalim(xys[, updatex, updatey])Extend the ~.Axes.dataLim Bbox to include the given points.
update_from(other)Copy properties from other to self.
violin(vpstats[, positions, vert, widths, ...])Drawing function for violin plots.
violinplot(dataset[, positions, vert, ...])Make a violin plot.
vlines(x, ymin, ymax[, colors, linestyles, ...])Plot vertical lines at each x from ymin to ymax.
xaxis_date([tz])Set up axis ticks and labels to treat data along the xaxis as dates.
Return whether the xaxis is oriented in the "inverse" direction.
xcorr(x, y[, normed, detrend, usevlines, ...])Plot the cross correlation between x and y.
yaxis_date([tz])Set up axis ticks and labels to treat data along the yaxis as dates.
Return whether the yaxis is oriented in the "inverse" direction.
Attributes
artistsThe ~.axes.Axes instance the artist resides in, or None.
collectionsimageslinesReturn whether this artist is queried for custom context information when the mouse cursor moves over it.
namepatchesWhether the artist is 'stale' and needs to be re-drawn for the output to match the internal state of the artist.
xandysticky edge lists for autoscaling.tablestextsWhen autoscaling, whether to obey all Artist.sticky_edges.
viewLimzorder- class ArtistList(axes, prop_name, add_name, valid_types=None, invalid_types=None)
Bases:
MutableSequenceA sublist of Axes children based on their type.
The type-specific children sublists will become immutable in Matplotlib 3.7. Then, these artist lists will likely be replaced by tuples. Use as if this is a tuple already.
This class exists only for the transition period to warn on the deprecated modification of artist lists.
- append(value)
S.append(value) – append value to the end of the sequence
- clear() None -- remove all items from S
- count(value) integer -- return number of occurrences of value
- extend(values)
S.extend(iterable) – extend sequence by appending elements from the iterable
- index(value[, start[, stop]]) integer -- return first index of value.
Raises ValueError if the value is not present.
Supporting start and stop arguments is optional, but recommended.
- insert(index, item)
S.insert(index, value) – insert value before index
- pop([index]) item -- remove and return item at index (default last).
Raise IndexError if list is empty or index is out of range.
- remove(value)
S.remove(value) – remove first occurrence of value. Raise ValueError if the value is not present.
- reverse()
S.reverse() – reverse IN PLACE
- acorr(x, *, data=None, **kwargs)[source]
Plot the autocorrelation of x.
Parameters
x : array-like
- detrendcallable, default: .mlab.detrend_none (no detrending)
A detrending function applied to x. It must have the signature
detrend(x: np.ndarray) -> np.ndarray
- normedbool, default: True
If
True, input vectors are normalised to unit length.- usevlinesbool, default: True
Determines the plot style.
If
True, vertical lines are plotted from 0 to the acorr value using .Axes.vlines. Additionally, a horizontal line is plotted at y=0 using .Axes.axhline.If
False, markers are plotted at the acorr values using .Axes.plot.- maxlagsint, default: 10
Number of lags to show. If
None, will return all2 * len(x) - 1lags.
Returns
- lagsarray (length
2*maxlags+1) The lag vector.
- carray (length
2*maxlags+1) The auto correlation vector.
- line.LineCollection or .Line2D
.Artist added to the Axes of the correlation:
.LineCollection if usevlines is True.
.Line2D if usevlines is False.
- b.Line2D or None
Horizontal line at 0 if usevlines is True None usevlines is False.
Other Parameters
- linestyle.Line2D property, optional
The linestyle for plotting the data points. Only used if usevlines is
False.- markerstr, default: ‘o’
The marker for plotting the data points. Only used if usevlines is
False.- dataindexable object, optional
If given, the following parameters also accept a string
s, which is interpreted asdata[s](unless this raises an exception):x
- **kwargs
Additional parameters are passed to .Axes.vlines and .Axes.axhline if usevlines is
True; otherwise they are passed to .Axes.plot.
Notes
The cross correlation is performed with numpy.correlate with
mode = "full".
- add_artist(a)
Add an .Artist to the Axes; return the artist.
Use add_artist only for artists for which there is no dedicated “add” method; and if necessary, use a method such as update_datalim to manually update the dataLim if the artist is to be included in autoscaling.
If no
transformhas been specified when creating the artist (e.g.artist.get_transform() == None) then the transform is set toax.transData.
- add_callback(func)
Add a callback function that will be called whenever one of the .Artist’s properties changes.
Parameters
- funccallable
The callback function. It must have the signature:
def func(artist: Artist) -> Any
where artist is the calling .Artist. Return values may exist but are ignored.
Returns
- int
The observer id associated with the callback. This id can be used for removing the callback with .remove_callback later.
See Also
remove_callback
- add_child_axes(ax)
Add an .AxesBase to the Axes’ children; return the child Axes.
This is the lowlevel version. See .axes.Axes.inset_axes.
- add_collection(collection, autolim=True)
Add a .Collection to the Axes; return the collection.
- add_container(container)
Add a .Container to the Axes’ containers; return the container.
- add_image(image)
Add an .AxesImage to the Axes; return the image.
- add_line(line)
Add a .Line2D to the Axes; return the line.
- add_patch(p)
Add a .Patch to the Axes; return the patch.
- add_table(tab)
Add a .Table to the Axes; return the table.
- angle_spectrum(x, Fs=None, Fc=None, window=None, pad_to=None, sides=None, *, data=None, **kwargs)[source]
Plot the angle spectrum.
Compute the angle spectrum (wrapped phase spectrum) of x. Data is padded to a length of pad_to and the windowing function window is applied to the signal.
Parameters
- x1-D array or sequence
Array or sequence containing the data.
- Fsfloat, default: 2
The sampling frequency (samples per time unit). It is used to calculate the Fourier frequencies, freqs, in cycles per time unit.
- windowcallable or ndarray, default: .window_hanning
A function or a vector of length NFFT. To create window vectors see .window_hanning, .window_none, numpy.blackman, numpy.hamming, numpy.bartlett, scipy.signal, scipy.signal.get_window, etc. If a function is passed as the argument, it must take a data segment as an argument and return the windowed version of the segment.
- sides{‘default’, ‘onesided’, ‘twosided’}, optional
Which sides of the spectrum to return. ‘default’ is one-sided for real data and two-sided for complex data. ‘onesided’ forces the return of a one-sided spectrum, while ‘twosided’ forces two-sided.
- pad_toint, optional
The number of points to which the data segment is padded when performing the FFT. While not increasing the actual resolution of the spectrum (the minimum distance between resolvable peaks), this can give more points in the plot, allowing for more detail. This corresponds to the n parameter in the call to ~numpy.fft.fft. The default is None, which sets pad_to equal to the length of the input signal (i.e. no padding).
- Fcint, default: 0
The center frequency of x, which offsets the x extents of the plot to reflect the frequency range used when a signal is acquired and then filtered and downsampled to baseband.
Returns
- spectrum1-D array
The values for the angle spectrum in radians (real valued).
- freqs1-D array
The frequencies corresponding to the elements in spectrum.
- line~matplotlib.lines.Line2D
The line created by this function.
Other Parameters
- dataindexable object, optional
If given, the following parameters also accept a string
s, which is interpreted asdata[s](unless this raises an exception):x
- **kwargs
Keyword arguments control the .Line2D properties:
Properties: agg_filter: a filter function, which takes a (m, n, 3) float array and a dpi value, and returns a (m, n, 3) array and two offsets from the bottom left corner of the image alpha: scalar or None animated: bool antialiased or aa: bool clip_box: .Bbox clip_on: bool clip_path: Patch or (Path, Transform) or None color or c: color dash_capstyle: .CapStyle or {‘butt’, ‘projecting’, ‘round’} dash_joinstyle: .JoinStyle or {‘miter’, ‘round’, ‘bevel’} dashes: sequence of floats (on/off ink in points) or (None, None) data: (2, N) array or two 1D arrays drawstyle or ds: {‘default’, ‘steps’, ‘steps-pre’, ‘steps-mid’, ‘steps-post’}, default: ‘default’ figure: .Figure fillstyle: {‘full’, ‘left’, ‘right’, ‘bottom’, ‘top’, ‘none’} gapcolor: color or None gid: str in_layout: bool label: object linestyle or ls: {‘-’, ‘–’, ‘-.’, ‘:’, ‘’, (offset, on-off-seq), …} linewidth or lw: float marker: marker style string, ~.path.Path or ~.markers.MarkerStyle markeredgecolor or mec: color markeredgewidth or mew: float markerfacecolor or mfc: color markerfacecoloralt or mfcalt: color markersize or ms: float markevery: None or int or (int, int) or slice or list[int] or float or (float, float) or list[bool] mouseover: bool path_effects: .AbstractPathEffect picker: float or callable[[Artist, Event], tuple[bool, dict]] pickradius: unknown rasterized: bool sketch_params: (scale: float, length: float, randomness: float) snap: bool or None solid_capstyle: .CapStyle or {‘butt’, ‘projecting’, ‘round’} solid_joinstyle: .JoinStyle or {‘miter’, ‘round’, ‘bevel’} transform: unknown url: str visible: bool xdata: 1D array ydata: 1D array zorder: float
See Also
- magnitude_spectrum
Plots the magnitudes of the corresponding frequencies.
- phase_spectrum
Plots the unwrapped version of this function.
- specgram
Can plot the angle spectrum of segments within the signal in a colormap.
- annotate(text, xy, xytext=None, xycoords='data', textcoords=None, arrowprops=None, annotation_clip=None, **kwargs)[source]
Annotate the point xy with text text.
In the simplest form, the text is placed at xy.
Optionally, the text can be displayed in another position xytext. An arrow pointing from the text to the annotated point xy can then be added by defining arrowprops.
Parameters
- textstr
The text of the annotation.
- xy(float, float)
The point (x, y) to annotate. The coordinate system is determined by xycoords.
- xytext(float, float), default: xy
The position (x, y) to place the text at. The coordinate system is determined by textcoords.
xycoords : str or .Artist or .Transform or callable or (float, float), default: ‘data’
The coordinate system that xy is given in. The following types of values are supported:
One of the following strings:
Value
Description
‘figure points’
Points from the lower left of the figure
‘figure pixels’
Pixels from the lower left of the figure
‘figure fraction’
Fraction of figure from lower left
‘subfigure points’
Points from the lower left of the subfigure
‘subfigure pixels’
Pixels from the lower left of the subfigure
‘subfigure fraction’
Fraction of subfigure from lower left
‘axes points’
Points from lower left corner of axes
‘axes pixels’
Pixels from lower left corner of axes
‘axes fraction’
Fraction of axes from lower left
‘data’
Use the coordinate system of the object being annotated (default)
‘polar’
(theta, r) if not native ‘data’ coordinates
Note that ‘subfigure pixels’ and ‘figure pixels’ are the same for the parent figure, so users who want code that is usable in a subfigure can use ‘subfigure pixels’.
An .Artist: xy is interpreted as a fraction of the artist’s ~matplotlib.transforms.Bbox. E.g. (0, 0) would be the lower left corner of the bounding box and (0.5, 1) would be the center top of the bounding box.
A .Transform to transform xy to screen coordinates.
A function with one of the following signatures:
def transform(renderer) -> Bbox
def transform(renderer) -> Transform
where renderer is a .RendererBase subclass.
The result of the function is interpreted like the .Artist and .Transform cases above.
A tuple (xcoords, ycoords) specifying separate coordinate systems for x and y. xcoords and ycoords must each be of one of the above described types.
See plotting-guide-annotation for more details.
- textcoordsstr or .Artist or .Transform or callable or (float, float), default: value of xycoords
The coordinate system that xytext is given in.
All xycoords values are valid as well as the following strings:
Value
Description
‘offset points’
Offset (in points) from the xy value
‘offset pixels’
Offset (in pixels) from the xy value
- arrowpropsdict, optional
The properties used to draw a .FancyArrowPatch arrow between the positions xy and xytext. Defaults to None, i.e. no arrow is drawn.
For historical reasons there are two different ways to specify arrows, “simple” and “fancy”:
Simple arrow:
If arrowprops does not contain the key ‘arrowstyle’ the allowed keys are:
Key
Description
width
The width of the arrow in points
headwidth
The width of the base of the arrow head in points
headlength
The length of the arrow head in points
shrink
Fraction of total length to shrink from both ends
?
Any key to
matplotlib.patches.FancyArrowPatchThe arrow is attached to the edge of the text box, the exact position (corners or centers) depending on where it’s pointing to.
Fancy arrow:
This is used if ‘arrowstyle’ is provided in the arrowprops.
Valid keys are the following ~matplotlib.patches.FancyArrowPatch parameters:
Key
Description
arrowstyle
the arrow style
connectionstyle
the connection style
relpos
see below; default is (0.5, 0.5)
patchA
default is bounding box of the text
patchB
default is None
shrinkA
default is 2 points
shrinkB
default is 2 points
mutation_scale
default is text size (in points)
mutation_aspect
default is 1.
?
any key for
matplotlib.patches.PathPatchThe exact starting point position of the arrow is defined by relpos. It’s a tuple of relative coordinates of the text box, where (0, 0) is the lower left corner and (1, 1) is the upper right corner. Values <0 and >1 are supported and specify points outside the text box. By default (0.5, 0.5) the starting point is centered in the text box.
- annotation_clipbool or None, default: None
Whether to clip (i.e. not draw) the annotation when the annotation point xy is outside the axes area.
If True, the annotation will be clipped when xy is outside the axes.
If False, the annotation will always be drawn.
If None, the annotation will be clipped when xy is outside the axes and xycoords is ‘data’.
- **kwargs
Additional kwargs are passed to ~matplotlib.text.Text.
Returns
.Annotation
See Also
plotting-guide-annotation
- apply_aspect(position=None)
Adjust the Axes for a specified data aspect ratio.
Depending on .get_adjustable this will modify either the Axes box (position) or the view limits. In the former case, ~matplotlib.axes.Axes.get_anchor will affect the position.
Parameters
- positionNone or .Bbox
If not
None, this defines the position of the Axes within the figure as a Bbox. See ~.Axes.get_position for further details.
Notes
This is called automatically when each Axes is drawn. You may need to call it yourself if you need to update the Axes position and/or view limits before the Figure is drawn.
See Also
- matplotlib.axes.Axes.set_aspect
For a description of aspect ratio handling.
- matplotlib.axes.Axes.set_adjustable
Set how the Axes adjusts to achieve the required aspect ratio.
- matplotlib.axes.Axes.set_anchor
Set the position in case of extra space.
- arrow(x, y, dx, dy, **kwargs)[source]
Add an arrow to the Axes.
This draws an arrow from
(x, y)to(x+dx, y+dy).Parameters
- x, yfloat
The x and y coordinates of the arrow base.
- dx, dyfloat
The length of the arrow along x and y direction.
- widthfloat, default: 0.001
Width of full arrow tail.
- length_includes_headbool, default: False
True if head is to be counted in calculating the length.
- head_widthfloat or None, default: 3*width
Total width of the full arrow head.
- head_lengthfloat or None, default: 1.5*head_width
Length of arrow head.
- shape{‘full’, ‘left’, ‘right’}, default: ‘full’
Draw the left-half, right-half, or full arrow.
- overhangfloat, default: 0
Fraction that the arrow is swept back (0 overhang means triangular shape). Can be negative or greater than one.
- head_starts_at_zerobool, default: False
If True, the head starts being drawn at coordinate 0 instead of ending at coordinate 0.
- **kwargs
.Patch properties:
Properties: agg_filter: a filter function, which takes a (m, n, 3) float array and a dpi value, and returns a (m, n, 3) array and two offsets from the bottom left corner of the image alpha: unknown animated: bool antialiased or aa: bool or None capstyle: .CapStyle or {‘butt’, ‘projecting’, ‘round’} clip_box: .Bbox clip_on: bool clip_path: Patch or (Path, Transform) or None color: color edgecolor or ec: color or None facecolor or fc: color or None figure: .Figure fill: bool gid: str hatch: {‘/’, ‘\’, ‘|’, ‘-’, ‘+’, ‘x’, ‘o’, ‘O’, ‘.’, ‘*’} in_layout: bool joinstyle: .JoinStyle or {‘miter’, ‘round’, ‘bevel’} label: object linestyle or ls: {‘-’, ‘–’, ‘-.’, ‘:’, ‘’, (offset, on-off-seq), …} linewidth or lw: float or None mouseover: bool path_effects: .AbstractPathEffect picker: None or bool or float or callable rasterized: bool sketch_params: (scale: float, length: float, randomness: float) snap: bool or None transform: .Transform url: str visible: bool zorder: float
Returns
- .FancyArrow
The created .FancyArrow object.
Notes
The resulting arrow is affected by the Axes aspect ratio and limits. This may produce an arrow whose head is not square with its stem. To create an arrow whose head is square with its stem, use
annotate()for example:>>> ax.annotate("", xy=(0.5, 0.5), xytext=(0, 0), ... arrowprops=dict(arrowstyle="->"))
- autoscale(enable=True, axis='both', tight=None)
Autoscale the axis view to the data (toggle).
Convenience method for simple axis view autoscaling. It turns autoscaling on or off, and then, if autoscaling for either axis is on, it performs the autoscaling on the specified axis or Axes.
Parameters
- enablebool or None, default: True
True turns autoscaling on, False turns it off. None leaves the autoscaling state unchanged.
- axis{‘both’, ‘x’, ‘y’}, default: ‘both’
The axis on which to operate. (For 3D Axes, axis can also be set to ‘z’, and ‘both’ refers to all three axes.)
- tightbool or None, default: None
If True, first set the margins to zero. Then, this argument is forwarded to ~.axes.Axes.autoscale_view (regardless of its value); see the description of its behavior there.
- autoscale_view(tight=None, scalex=True, scaley=True)
Autoscale the view limits using the data limits.
Parameters
- tightbool or None
If True, only expand the axis limits using the margins. Note that unlike for autoscale,
tight=Truedoes not set the margins to zero.If False and :rc:`axes.autolimit_mode` is ‘round_numbers’, then after expansion by the margins, further expand the axis limits using the axis major locator.
If None (the default), reuse the value set in the previous call to autoscale_view (the initial value is False, but the default style sets :rc:`axes.autolimit_mode` to ‘data’, in which case this behaves like True).
- scalexbool, default: True
Whether to autoscale the x axis.
- scaleybool, default: True
Whether to autoscale the y axis.
Notes
The autoscaling preserves any preexisting axis direction reversal.
The data limits are not updated automatically when artist data are changed after the artist has been added to an Axes instance. In that case, use
matplotlib.axes.Axes.relim()prior to calling autoscale_view.If the views of the Axes are fixed, e.g. via set_xlim, they will not be changed by autoscale_view(). See
matplotlib.axes.Axes.autoscale()for an alternative.
- property axes
The ~.axes.Axes instance the artist resides in, or None.
- axhline(y=0, xmin=0, xmax=1, **kwargs)[source]
Add a horizontal line across the Axes.
Parameters
- yfloat, default: 0
y position in data coordinates of the horizontal line.
- xminfloat, default: 0
Should be between 0 and 1, 0 being the far left of the plot, 1 the far right of the plot.
- xmaxfloat, default: 1
Should be between 0 and 1, 0 being the far left of the plot, 1 the far right of the plot.
Returns
~matplotlib.lines.Line2D
Other Parameters
- **kwargs
Valid keyword arguments are .Line2D properties, with the exception of ‘transform’:
Properties: agg_filter: a filter function, which takes a (m, n, 3) float array and a dpi value, and returns a (m, n, 3) array and two offsets from the bottom left corner of the image alpha: scalar or None animated: bool antialiased or aa: bool clip_box: .Bbox clip_on: bool clip_path: Patch or (Path, Transform) or None color or c: color dash_capstyle: .CapStyle or {‘butt’, ‘projecting’, ‘round’} dash_joinstyle: .JoinStyle or {‘miter’, ‘round’, ‘bevel’} dashes: sequence of floats (on/off ink in points) or (None, None) data: (2, N) array or two 1D arrays drawstyle or ds: {‘default’, ‘steps’, ‘steps-pre’, ‘steps-mid’, ‘steps-post’}, default: ‘default’ figure: .Figure fillstyle: {‘full’, ‘left’, ‘right’, ‘bottom’, ‘top’, ‘none’} gapcolor: color or None gid: str in_layout: bool label: object linestyle or ls: {‘-’, ‘–’, ‘-.’, ‘:’, ‘’, (offset, on-off-seq), …} linewidth or lw: float marker: marker style string, ~.path.Path or ~.markers.MarkerStyle markeredgecolor or mec: color markeredgewidth or mew: float markerfacecolor or mfc: color markerfacecoloralt or mfcalt: color markersize or ms: float markevery: None or int or (int, int) or slice or list[int] or float or (float, float) or list[bool] mouseover: bool path_effects: .AbstractPathEffect picker: float or callable[[Artist, Event], tuple[bool, dict]] pickradius: unknown rasterized: bool sketch_params: (scale: float, length: float, randomness: float) snap: bool or None solid_capstyle: .CapStyle or {‘butt’, ‘projecting’, ‘round’} solid_joinstyle: .JoinStyle or {‘miter’, ‘round’, ‘bevel’} transform: unknown url: str visible: bool xdata: 1D array ydata: 1D array zorder: float
See Also
hlines : Add horizontal lines in data coordinates. axhspan : Add a horizontal span (rectangle) across the axis. axline : Add a line with an arbitrary slope.
Examples
draw a thick red hline at ‘y’ = 0 that spans the xrange:
>>> axhline(linewidth=4, color='r')
draw a default hline at ‘y’ = 1 that spans the xrange:
>>> axhline(y=1)
draw a default hline at ‘y’ = .5 that spans the middle half of the xrange:
>>> axhline(y=.5, xmin=0.25, xmax=0.75)
- axhspan(ymin, ymax, xmin=0, xmax=1, **kwargs)[source]
Add a horizontal span (rectangle) across the Axes.
The rectangle spans from ymin to ymax vertically, and, by default, the whole x-axis horizontally. The x-span can be set using xmin (default: 0) and xmax (default: 1) which are in axis units; e.g.
xmin = 0.5always refers to the middle of the x-axis regardless of the limits set by ~.Axes.set_xlim.Parameters
- yminfloat
Lower y-coordinate of the span, in data units.
- ymaxfloat
Upper y-coordinate of the span, in data units.
- xminfloat, default: 0
Lower x-coordinate of the span, in x-axis (0-1) units.
- xmaxfloat, default: 1
Upper x-coordinate of the span, in x-axis (0-1) units.
Returns
- ~matplotlib.patches.Polygon
Horizontal span (rectangle) from (xmin, ymin) to (xmax, ymax).
Other Parameters
**kwargs : ~matplotlib.patches.Polygon properties
- Properties:
agg_filter: a filter function, which takes a (m, n, 3) float array and a dpi value, and returns a (m, n, 3) array and two offsets from the bottom left corner of the image alpha: scalar or None animated: bool antialiased or aa: bool or None capstyle: .CapStyle or {‘butt’, ‘projecting’, ‘round’} clip_box: .Bbox clip_on: bool clip_path: Patch or (Path, Transform) or None closed: bool color: color edgecolor or ec: color or None facecolor or fc: color or None figure: .Figure fill: bool gid: str hatch: {‘/’, ‘\’, ‘|’, ‘-’, ‘+’, ‘x’, ‘o’, ‘O’, ‘.’, ‘*’} in_layout: bool joinstyle: .JoinStyle or {‘miter’, ‘round’, ‘bevel’} label: object linestyle or ls: {‘-’, ‘–’, ‘-.’, ‘:’, ‘’, (offset, on-off-seq), …} linewidth or lw: float or None mouseover: bool path_effects: .AbstractPathEffect picker: None or bool or float or callable rasterized: bool sketch_params: (scale: float, length: float, randomness: float) snap: bool or None transform: .Transform url: str visible: bool xy: (N, 2) array-like zorder: float
See Also
axvspan : Add a vertical span across the Axes.
- axis(*args, emit=True, **kwargs)
Convenience method to get or set some axis properties.
Call signatures:
xmin, xmax, ymin, ymax = axis()
xmin, xmax, ymin, ymax = axis([xmin, xmax, ymin, ymax])
xmin, xmax, ymin, ymax = axis(option)
xmin, xmax, ymin, ymax = axis(**kwargs)
Parameters
- xmin, xmax, ymin, ymaxfloat, optional
The axis limits to be set. This can also be achieved using
ax.set(xlim=(xmin, xmax), ylim=(ymin, ymax))
- optionbool or str
If a bool, turns axis lines and labels on or off. If a string, possible values are:
Value
Description
‘on’
Turn on axis lines and labels. Same as
True.‘off’
Turn off axis lines and labels. Same as
False.‘equal’
Set equal scaling (i.e., make circles circular) by changing axis limits. This is the same as
ax.set_aspect('equal', adjustable='datalim'). Explicit data limits may not be respected in this case.‘scaled’
Set equal scaling (i.e., make circles circular) by changing dimensions of the plot box. This is the same as
ax.set_aspect('equal', adjustable='box', anchor='C'). Additionally, further autoscaling will be disabled.‘tight’
Set limits just large enough to show all data, then disable further autoscaling.
‘auto’
Automatic scaling (fill plot box with data).
‘image’
‘scaled’ with axis limits equal to data limits.
‘square’
Square plot; similar to ‘scaled’, but initially forcing
xmax-xmin == ymax-ymin.- emitbool, default: True
Whether observers are notified of the axis limit change. This option is passed on to ~.Axes.set_xlim and ~.Axes.set_ylim.
Returns
- xmin, xmax, ymin, ymaxfloat
The axis limits.
See Also
matplotlib.axes.Axes.set_xlim matplotlib.axes.Axes.set_ylim
- axline(xy1, xy2=None, *, slope=None, **kwargs)[source]
Add an infinitely long straight line.
The line can be defined either by two points xy1 and xy2, or by one point xy1 and a slope.
This draws a straight line “on the screen”, regardless of the x and y scales, and is thus also suitable for drawing exponential decays in semilog plots, power laws in loglog plots, etc. However, slope should only be used with linear scales; It has no clear meaning for all other scales, and thus the behavior is undefined. Please specify the line using the points xy1, xy2 for non-linear scales.
The transform keyword argument only applies to the points xy1, xy2. The slope (if given) is always in data coordinates. This can be used e.g. with
ax.transAxesfor drawing grid lines with a fixed slope.Parameters
- xy1, xy2(float, float)
Points for the line to pass through. Either xy2 or slope has to be given.
- slopefloat, optional
The slope of the line. Either xy2 or slope has to be given.
Returns
.Line2D
Other Parameters
- **kwargs
Valid kwargs are .Line2D properties
Properties: agg_filter: a filter function, which takes a (m, n, 3) float array and a dpi value, and returns a (m, n, 3) array and two offsets from the bottom left corner of the image alpha: scalar or None animated: bool antialiased or aa: bool clip_box: .Bbox clip_on: bool clip_path: Patch or (Path, Transform) or None color or c: color dash_capstyle: .CapStyle or {‘butt’, ‘projecting’, ‘round’} dash_joinstyle: .JoinStyle or {‘miter’, ‘round’, ‘bevel’} dashes: sequence of floats (on/off ink in points) or (None, None) data: (2, N) array or two 1D arrays drawstyle or ds: {‘default’, ‘steps’, ‘steps-pre’, ‘steps-mid’, ‘steps-post’}, default: ‘default’ figure: .Figure fillstyle: {‘full’, ‘left’, ‘right’, ‘bottom’, ‘top’, ‘none’} gapcolor: color or None gid: str in_layout: bool label: object linestyle or ls: {‘-’, ‘–’, ‘-.’, ‘:’, ‘’, (offset, on-off-seq), …} linewidth or lw: float marker: marker style string, ~.path.Path or ~.markers.MarkerStyle markeredgecolor or mec: color markeredgewidth or mew: float markerfacecolor or mfc: color markerfacecoloralt or mfcalt: color markersize or ms: float markevery: None or int or (int, int) or slice or list[int] or float or (float, float) or list[bool] mouseover: bool path_effects: .AbstractPathEffect picker: float or callable[[Artist, Event], tuple[bool, dict]] pickradius: unknown rasterized: bool sketch_params: (scale: float, length: float, randomness: float) snap: bool or None solid_capstyle: .CapStyle or {‘butt’, ‘projecting’, ‘round’} solid_joinstyle: .JoinStyle or {‘miter’, ‘round’, ‘bevel’} transform: unknown url: str visible: bool xdata: 1D array ydata: 1D array zorder: float
See Also
axhline : for horizontal lines axvline : for vertical lines
Examples
Draw a thick red line passing through (0, 0) and (1, 1):
>>> axline((0, 0), (1, 1), linewidth=4, color='r')
- axvline(x=0, ymin=0, ymax=1, **kwargs)[source]
Add a vertical line across the Axes.
Parameters
- xfloat, default: 0
x position in data coordinates of the vertical line.
- yminfloat, default: 0
Should be between 0 and 1, 0 being the bottom of the plot, 1 the top of the plot.
- ymaxfloat, default: 1
Should be between 0 and 1, 0 being the bottom of the plot, 1 the top of the plot.
Returns
~matplotlib.lines.Line2D
Other Parameters
- **kwargs
Valid keyword arguments are .Line2D properties, with the exception of ‘transform’:
Properties: agg_filter: a filter function, which takes a (m, n, 3) float array and a dpi value, and returns a (m, n, 3) array and two offsets from the bottom left corner of the image alpha: scalar or None animated: bool antialiased or aa: bool clip_box: .Bbox clip_on: bool clip_path: Patch or (Path, Transform) or None color or c: color dash_capstyle: .CapStyle or {‘butt’, ‘projecting’, ‘round’} dash_joinstyle: .JoinStyle or {‘miter’, ‘round’, ‘bevel’} dashes: sequence of floats (on/off ink in points) or (None, None) data: (2, N) array or two 1D arrays drawstyle or ds: {‘default’, ‘steps’, ‘steps-pre’, ‘steps-mid’, ‘steps-post’}, default: ‘default’ figure: .Figure fillstyle: {‘full’, ‘left’, ‘right’, ‘bottom’, ‘top’, ‘none’} gapcolor: color or None gid: str in_layout: bool label: object linestyle or ls: {‘-’, ‘–’, ‘-.’, ‘:’, ‘’, (offset, on-off-seq), …} linewidth or lw: float marker: marker style string, ~.path.Path or ~.markers.MarkerStyle markeredgecolor or mec: color markeredgewidth or mew: float markerfacecolor or mfc: color markerfacecoloralt or mfcalt: color markersize or ms: float markevery: None or int or (int, int) or slice or list[int] or float or (float, float) or list[bool] mouseover: bool path_effects: .AbstractPathEffect picker: float or callable[[Artist, Event], tuple[bool, dict]] pickradius: unknown rasterized: bool sketch_params: (scale: float, length: float, randomness: float) snap: bool or None solid_capstyle: .CapStyle or {‘butt’, ‘projecting’, ‘round’} solid_joinstyle: .JoinStyle or {‘miter’, ‘round’, ‘bevel’} transform: unknown url: str visible: bool xdata: 1D array ydata: 1D array zorder: float
See Also
vlines : Add vertical lines in data coordinates. axvspan : Add a vertical span (rectangle) across the axis. axline : Add a line with an arbitrary slope.
Examples
draw a thick red vline at x = 0 that spans the yrange:
>>> axvline(linewidth=4, color='r')
draw a default vline at x = 1 that spans the yrange:
>>> axvline(x=1)
draw a default vline at x = .5 that spans the middle half of the yrange:
>>> axvline(x=.5, ymin=0.25, ymax=0.75)
- axvspan(xmin, xmax, ymin=0, ymax=1, **kwargs)[source]
Add a vertical span (rectangle) across the Axes.
The rectangle spans from xmin to xmax horizontally, and, by default, the whole y-axis vertically. The y-span can be set using ymin (default: 0) and ymax (default: 1) which are in axis units; e.g.
ymin = 0.5always refers to the middle of the y-axis regardless of the limits set by ~.Axes.set_ylim.Parameters
- xminfloat
Lower x-coordinate of the span, in data units.
- xmaxfloat
Upper x-coordinate of the span, in data units.
- yminfloat, default: 0
Lower y-coordinate of the span, in y-axis units (0-1).
- ymaxfloat, default: 1
Upper y-coordinate of the span, in y-axis units (0-1).
Returns
- ~matplotlib.patches.Polygon
Vertical span (rectangle) from (xmin, ymin) to (xmax, ymax).
Other Parameters
**kwargs : ~matplotlib.patches.Polygon properties
- Properties:
agg_filter: a filter function, which takes a (m, n, 3) float array and a dpi value, and returns a (m, n, 3) array and two offsets from the bottom left corner of the image alpha: scalar or None animated: bool antialiased or aa: bool or None capstyle: .CapStyle or {‘butt’, ‘projecting’, ‘round’} clip_box: .Bbox clip_on: bool clip_path: Patch or (Path, Transform) or None closed: bool color: color edgecolor or ec: color or None facecolor or fc: color or None figure: .Figure fill: bool gid: str hatch: {‘/’, ‘\’, ‘|’, ‘-’, ‘+’, ‘x’, ‘o’, ‘O’, ‘.’, ‘*’} in_layout: bool joinstyle: .JoinStyle or {‘miter’, ‘round’, ‘bevel’} label: object linestyle or ls: {‘-’, ‘–’, ‘-.’, ‘:’, ‘’, (offset, on-off-seq), …} linewidth or lw: float or None mouseover: bool path_effects: .AbstractPathEffect picker: None or bool or float or callable rasterized: bool sketch_params: (scale: float, length: float, randomness: float) snap: bool or None transform: .Transform url: str visible: bool xy: (N, 2) array-like zorder: float
See Also
axhspan : Add a horizontal span across the Axes.
Examples
Draw a vertical, green, translucent rectangle from x = 1.25 to x = 1.55 that spans the yrange of the Axes.
>>> axvspan(1.25, 1.55, facecolor='g', alpha=0.5)
- bar(x, height, width=0.8, bottom=None, *, align='center', data=None, **kwargs)[source]
Make a bar plot.
The bars are positioned at x with the given alignment. Their dimensions are given by height and width. The vertical baseline is bottom (default 0).
Many parameters can take either a single value applying to all bars or a sequence of values, one for each bar.
Parameters
- xfloat or array-like
The x coordinates of the bars. See also align for the alignment of the bars to the coordinates.
- heightfloat or array-like
The height(s) of the bars.
- widthfloat or array-like, default: 0.8
The width(s) of the bars.
- bottomfloat or array-like, default: 0
The y coordinate(s) of the bottom side(s) of the bars.
- align{‘center’, ‘edge’}, default: ‘center’
Alignment of the bars to the x coordinates:
‘center’: Center the base on the x positions.
‘edge’: Align the left edges of the bars with the x positions.
To align the bars on the right edge pass a negative width and
align='edge'.
Returns
- .BarContainer
Container with all the bars and optionally errorbars.
Other Parameters
- colorcolor or list of color, optional
The colors of the bar faces.
- edgecolorcolor or list of color, optional
The colors of the bar edges.
- linewidthfloat or array-like, optional
Width of the bar edge(s). If 0, don’t draw edges.
- tick_labelstr or list of str, optional
The tick labels of the bars. Default: None (Use default numeric labels.)
- labelstr or list of str, optional
A single label is attached to the resulting .BarContainer as a label for the whole dataset. If a list is provided, it must be the same length as x and labels the individual bars. Repeated labels are not de-duplicated and will cause repeated label entries, so this is best used when bars also differ in style (e.g., by passing a list to color.)
- xerr, yerrfloat or array-like of shape(N,) or shape(2, N), optional
If not None, add horizontal / vertical errorbars to the bar tips. The values are +/- sizes relative to the data:
scalar: symmetric +/- values for all bars
shape(N,): symmetric +/- values for each bar
shape(2, N): Separate - and + values for each bar. First row contains the lower errors, the second row contains the upper errors.
None: No errorbar. (Default)
See /gallery/statistics/errorbar_features for an example on the usage of xerr and yerr.
- ecolorcolor or list of color, default: ‘black’
The line color of the errorbars.
- capsizefloat, default: :rc:`errorbar.capsize`
The length of the error bar caps in points.
- error_kwdict, optional
Dictionary of keyword arguments to be passed to the ~.Axes.errorbar method. Values of ecolor or capsize defined here take precedence over the independent keyword arguments.
- logbool, default: False
If True, set the y-axis to be log scale.
- dataindexable object, optional
If given, all parameters also accept a string
s, which is interpreted asdata[s](unless this raises an exception).
**kwargs : .Rectangle properties
- Properties:
agg_filter: a filter function, which takes a (m, n, 3) float array and a dpi value, and returns a (m, n, 3) array and two offsets from the bottom left corner of the image alpha: scalar or None angle: unknown animated: bool antialiased or aa: bool or None bounds: (left, bottom, width, height) capstyle: .CapStyle or {‘butt’, ‘projecting’, ‘round’} clip_box: .Bbox clip_on: bool clip_path: Patch or (Path, Transform) or None color: color edgecolor or ec: color or None facecolor or fc: color or None figure: .Figure fill: bool gid: str hatch: {‘/’, ‘\’, ‘|’, ‘-’, ‘+’, ‘x’, ‘o’, ‘O’, ‘.’, ‘*’} height: unknown in_layout: bool joinstyle: .JoinStyle or {‘miter’, ‘round’, ‘bevel’} label: object linestyle or ls: {‘-’, ‘–’, ‘-.’, ‘:’, ‘’, (offset, on-off-seq), …} linewidth or lw: float or None mouseover: bool path_effects: .AbstractPathEffect picker: None or bool or float or callable rasterized: bool sketch_params: (scale: float, length: float, randomness: float) snap: bool or None transform: .Transform url: str visible: bool width: unknown x: unknown xy: (float, float) y: unknown zorder: float
See Also
barh : Plot a horizontal bar plot.
Notes
Stacked bars can be achieved by passing individual bottom values per bar. See /gallery/lines_bars_and_markers/bar_stacked.
- bar_label(container, labels=None, *, fmt='%g', label_type='edge', padding=0, **kwargs)[source]
Label a bar plot.
Adds labels to bars in the given .BarContainer. You may need to adjust the axis limits to fit the labels.
Parameters
- container.BarContainer
Container with all the bars and optionally errorbars, likely returned from .bar or .barh.
- labelsarray-like, optional
A list of label texts, that should be displayed. If not given, the label texts will be the data values formatted with fmt.
- fmtstr, default: ‘%g’
A format string for the label.
- label_type{‘edge’, ‘center’}, default: ‘edge’
The label type. Possible values:
‘edge’: label placed at the end-point of the bar segment, and the value displayed will be the position of that end-point.
‘center’: label placed in the center of the bar segment, and the value displayed will be the length of that segment. (useful for stacked bars, i.e., /gallery/lines_bars_and_markers/bar_label_demo)
- paddingfloat, default: 0
Distance of label from the end of the bar, in points.
- **kwargs
Any remaining keyword arguments are passed through to .Axes.annotate. The alignment parameters ( horizontalalignment / ha, verticalalignment / va) are not supported because the labels are automatically aligned to the bars.
Returns
- list of .Text
A list of .Text instances for the labels.
- barbs(*args, data=None, **kwargs)[source]
Plot a 2D field of barbs.
Call signature:
barbs([X, Y], U, V, [C], **kwargs)
Where X, Y define the barb locations, U, V define the barb directions, and C optionally sets the color.
All arguments may be 1D or 2D. U, V, C may be masked arrays, but masked X, Y are not supported at present.
Barbs are traditionally used in meteorology as a way to plot the speed and direction of wind observations, but can technically be used to plot any two dimensional vector quantity. As opposed to arrows, which give vector magnitude by the length of the arrow, the barbs give more quantitative information about the vector magnitude by putting slanted lines or a triangle for various increments in magnitude, as show schematically below:
:                   /\    \
:                  /  \    \
:                 /    \    \    \
:                /      \    \    \
:               ------------------------------
The largest increment is given by a triangle (or “flag”). After those come full lines (barbs). The smallest increment is a half line. There is only, of course, ever at most 1 half line. If the magnitude is small and only needs a single half-line and no full lines or triangles, the half-line is offset from the end of the barb so that it can be easily distinguished from barbs with a single full line. The magnitude for the barb shown above would nominally be 65, using the standard increments of 50, 10, and 5.
See also https://en.wikipedia.org/wiki/Wind_barb.
Parameters
- X, Y1D or 2D array-like, optional
The x and y coordinates of the barb locations. See pivot for how the barbs are drawn to the x, y positions.
If not given, they will be generated as a uniform integer meshgrid based on the dimensions of U and V.
If X and Y are 1D but U, V are 2D, X, Y are expanded to 2D using
X, Y = np.meshgrid(X, Y). In this caselen(X)andlen(Y)must match the column and row dimensions of U and V.- U, V1D or 2D array-like
The x and y components of the barb shaft.
- C1D or 2D array-like, optional
Numeric data that defines the barb colors by colormapping via norm and cmap.
This does not support explicit colors. If you want to set colors directly, use barbcolor instead.
- lengthfloat, default: 7
Length of the barb in points; the other parts of the barb are scaled against this.
- pivot{‘tip’, ‘middle’} or float, default: ‘tip’
The part of the arrow that is anchored to the X, Y grid. The barb rotates about this point. This can also be a number, which shifts the start of the barb that many points away from grid point.
- barbcolorcolor or color sequence
The color of all parts of the barb except for the flags. This parameter is analogous to the edgecolor parameter for polygons, which can be used instead. However this parameter will override facecolor.
- flagcolorcolor or color sequence
The color of any flags on the barb. This parameter is analogous to the facecolor parameter for polygons, which can be used instead. However, this parameter will override facecolor. If this is not set (and C has not either) then flagcolor will be set to match barbcolor so that the barb has a uniform color. If C has been set, flagcolor has no effect.
- sizesdict, optional
A dictionary of coefficients specifying the ratio of a given feature to the length of the barb. Only those values one wishes to override need to be included. These features include:
‘spacing’ - space between features (flags, full/half barbs)
‘height’ - height (distance from shaft to top) of a flag or full barb
‘width’ - width of a flag, twice the width of a full barb
‘emptybarb’ - radius of the circle used for low magnitudes
- fill_emptybool, default: False
Whether the empty barbs (circles) that are drawn should be filled with the flag color. If they are not filled, the center is transparent.
- roundingbool, default: True
Whether the vector magnitude should be rounded when allocating barb components. If True, the magnitude is rounded to the nearest multiple of the half-barb increment. If False, the magnitude is simply truncated to the next lowest multiple.
- barb_incrementsdict, optional
A dictionary of increments specifying values to associate with different parts of the barb. Only those values one wishes to override need to be included.
‘half’ - half barbs (Default is 5)
‘full’ - full barbs (Default is 10)
‘flag’ - flags (default is 50)
- flip_barbbool or array-like of bool, default: False
Whether the lines and flags should point opposite to normal. Normal behavior is for the barbs and lines to point right (comes from wind barbs having these features point towards low pressure in the Northern Hemisphere).
A single value is applied to all barbs. Individual barbs can be flipped by passing a bool array of the same size as U and V.
Returns
barbs : ~matplotlib.quiver.Barbs
Other Parameters
- dataindexable object, optional
If given, all parameters also accept a string
s, which is interpreted asdata[s](unless this raises an exception).- **kwargs
The barbs can further be customized using .PolyCollection keyword arguments:
Properties: agg_filter: a filter function, which takes a (m, n, 3) float array and a dpi value, and returns a (m, n, 3) array and two offsets from the bottom left corner of the image alpha: array-like or scalar or None animated: bool antialiased or aa or antialiaseds: bool or list of bools array: array-like or None capstyle: .CapStyle or {‘butt’, ‘projecting’, ‘round’} clim: (vmin: float, vmax: float) clip_box: .Bbox clip_on: bool clip_path: Patch or (Path, Transform) or None cmap: .Colormap or str or None color: color or list of rgba tuples edgecolor or ec or edgecolors: color or list of colors or ‘face’ facecolor or facecolors or fc: color or list of colors figure: .Figure gid: str hatch: {‘/’, ‘\’, ‘|’, ‘-’, ‘+’, ‘x’, ‘o’, ‘O’, ‘.’, ‘*’} in_layout: bool joinstyle: .JoinStyle or {‘miter’, ‘round’, ‘bevel’} label: object linestyle or dashes or linestyles or ls: str or tuple or list thereof linewidth or linewidths or lw: float or list of floats mouseover: bool norm: .Normalize or str or None offset_transform or transOffset: unknown offsets: (N, 2) or (2,) array-like path_effects: .AbstractPathEffect paths: list of array-like picker: None or bool or float or callable pickradius: unknown rasterized: bool sizes: ndarray or None sketch_params: (scale: float, length: float, randomness: float) snap: bool or None transform: .Transform url: str urls: list of str or None verts: list of array-like verts_and_codes: unknown visible: bool zorder: float
- barh(y, width, height=0.8, left=None, *, align='center', data=None, **kwargs)[source]
Make a horizontal bar plot.
The bars are positioned at y with the given alignment. Their dimensions are given by width and height. The horizontal baseline is left (default 0).
Many parameters can take either a single value applying to all bars or a sequence of values, one for each bar.
Parameters
- yfloat or array-like
The y coordinates of the bars. See also align for the alignment of the bars to the coordinates.
- widthfloat or array-like
The width(s) of the bars.
- heightfloat or array-like, default: 0.8
The heights of the bars.
- leftfloat or array-like, default: 0
The x coordinates of the left side(s) of the bars.
- align{‘center’, ‘edge’}, default: ‘center’
Alignment of the base to the y coordinates*:
‘center’: Center the bars on the y positions.
‘edge’: Align the bottom edges of the bars with the y positions.
To align the bars on the top edge pass a negative height and
align='edge'.
Returns
- .BarContainer
Container with all the bars and optionally errorbars.
Other Parameters
- colorcolor or list of color, optional
The colors of the bar faces.
- edgecolorcolor or list of color, optional
The colors of the bar edges.
- linewidthfloat or array-like, optional
Width of the bar edge(s). If 0, don’t draw edges.
- tick_labelstr or list of str, optional
The tick labels of the bars. Default: None (Use default numeric labels.)
- labelstr or list of str, optional
A single label is attached to the resulting .BarContainer as a label for the whole dataset. If a list is provided, it must be the same length as y and labels the individual bars. Repeated labels are not de-duplicated and will cause repeated label entries, so this is best used when bars also differ in style (e.g., by passing a list to color.)
- xerr, yerrfloat or array-like of shape(N,) or shape(2, N), optional
If not None, add horizontal / vertical errorbars to the bar tips. The values are +/- sizes relative to the data:
scalar: symmetric +/- values for all bars
shape(N,): symmetric +/- values for each bar
shape(2, N): Separate - and + values for each bar. First row contains the lower errors, the second row contains the upper errors.
None: No errorbar. (default)
See /gallery/statistics/errorbar_features for an example on the usage of xerr and yerr.
- ecolorcolor or list of color, default: ‘black’
The line color of the errorbars.
- capsizefloat, default: :rc:`errorbar.capsize`
The length of the error bar caps in points.
- error_kwdict, optional
Dictionary of keyword arguments to be passed to the ~.Axes.errorbar method. Values of ecolor or capsize defined here take precedence over the independent keyword arguments.
- logbool, default: False
If
True, set the x-axis to be log scale.- dataindexable object, optional
If given, all parameters also accept a string
s, which is interpreted asdata[s](unless this raises an exception).
**kwargs : .Rectangle properties
- Properties:
agg_filter: a filter function, which takes a (m, n, 3) float array and a dpi value, and returns a (m, n, 3) array and two offsets from the bottom left corner of the image alpha: scalar or None angle: unknown animated: bool antialiased or aa: bool or None bounds: (left, bottom, width, height) capstyle: .CapStyle or {‘butt’, ‘projecting’, ‘round’} clip_box: .Bbox clip_on: bool clip_path: Patch or (Path, Transform) or None color: color edgecolor or ec: color or None facecolor or fc: color or None figure: .Figure fill: bool gid: str hatch: {‘/’, ‘\’, ‘|’, ‘-’, ‘+’, ‘x’, ‘o’, ‘O’, ‘.’, ‘*’} height: unknown in_layout: bool joinstyle: .JoinStyle or {‘miter’, ‘round’, ‘bevel’} label: object linestyle or ls: {‘-’, ‘–’, ‘-.’, ‘:’, ‘’, (offset, on-off-seq), …} linewidth or lw: float or None mouseover: bool path_effects: .AbstractPathEffect picker: None or bool or float or callable rasterized: bool sketch_params: (scale: float, length: float, randomness: float) snap: bool or None transform: .Transform url: str visible: bool width: unknown x: unknown xy: (float, float) y: unknown zorder: float
See Also
bar : Plot a vertical bar plot.
Notes
Stacked bars can be achieved by passing individual left values per bar. See /gallery/lines_bars_and_markers/horizontal_barchart_distribution.
- boxplot(x, notch=None, sym=None, vert=None, whis=None, positions=None, widths=None, patch_artist=None, bootstrap=None, usermedians=None, conf_intervals=None, meanline=None, showmeans=None, showcaps=None, showbox=None, showfliers=None, boxprops=None, labels=None, flierprops=None, medianprops=None, meanprops=None, capprops=None, whiskerprops=None, manage_ticks=True, autorange=False, zorder=None, capwidths=None, *, data=None)[source]
Draw a box and whisker plot.
The box extends from the first quartile (Q1) to the third quartile (Q3) of the data, with a line at the median. The whiskers extend from the box by 1.5x the inter-quartile range (IQR). Flier points are those past the end of the whiskers. See https://en.wikipedia.org/wiki/Box_plot for reference.
     Q1-1.5IQR   Q1   median  Q3   Q3+1.5IQR
                  |-----:-----|
  o      |--------|     :     |--------|    o  o
                  |-----:-----|
flier             <----------->            fliers
                       IQR
Parameters
- xArray or a sequence of vectors.
The input data. If a 2D array, a boxplot is drawn for each column in x. If a sequence of 1D arrays, a boxplot is drawn for each array in x.
- notchbool, default: False
Whether to draw a notched boxplot (True), or a rectangular boxplot (False). The notches represent the confidence interval (CI) around the median. The documentation for bootstrap describes how the locations of the notches are computed by default, but their locations may also be overridden by setting the conf_intervals parameter.
Note
In cases where the values of the CI are less than the lower quartile or greater than the upper quartile, the notches will extend beyond the box, giving it a distinctive “flipped” appearance. This is expected behavior and consistent with other statistical visualization packages.
- symstr, optional
The default symbol for flier points. An empty string (‘’) hides the fliers. If None, then the fliers default to ‘b+’. More control is provided by the flierprops parameter.
- vertbool, default: True
If True, draws vertical boxes. If False, draw horizontal boxes.
- whisfloat or (float, float), default: 1.5
The position of the whiskers.
If a float, the lower whisker is at the lowest datum above
Q1 - whis*(Q3-Q1), and the upper whisker at the highest datum belowQ3 + whis*(Q3-Q1), where Q1 and Q3 are the first and third quartiles. The default value ofwhis = 1.5corresponds to Tukey’s original definition of boxplots.If a pair of floats, they indicate the percentiles at which to draw the whiskers (e.g., (5, 95)). In particular, setting this to (0, 100) results in whiskers covering the whole range of the data.
In the edge case where
Q1 == Q3, whis is automatically set to (0, 100) (cover the whole range of the data) if autorange is True.Beyond the whiskers, data are considered outliers and are plotted as individual points.
- bootstrapint, optional
Specifies whether to bootstrap the confidence intervals around the median for notched boxplots. If bootstrap is None, no bootstrapping is performed, and notches are calculated using a Gaussian-based asymptotic approximation (see McGill, R., Tukey, J.W., and Larsen, W.A., 1978, and Kendall and Stuart, 1967). Otherwise, bootstrap specifies the number of times to bootstrap the median to determine its 95% confidence intervals. Values between 1000 and 10000 are recommended.
- usermedians1D array-like, optional
A 1D array-like of length
len(x). Each entry that is not None forces the value of the median for the corresponding dataset. For entries that are None, the medians are computed by Matplotlib as normal.- conf_intervalsarray-like, optional
A 2D array-like of shape
(len(x), 2). Each entry that is not None forces the location of the corresponding notch (which is only drawn if notch is True). For entries that are None, the notches are computed by the method specified by the other parameters (e.g., bootstrap).- positionsarray-like, optional
The positions of the boxes. The ticks and limits are automatically set to match the positions. Defaults to
range(1, N+1)where N is the number of boxes to be drawn.- widthsfloat or array-like
The widths of the boxes. The default is 0.5, or
0.15*(distance
between extreme positions)
, if that is smaller.- patch_artistbool, default: False
If False produces boxes with the Line2D artist. Otherwise, boxes are drawn with Patch artists.
- labelssequence, optional
Labels for each dataset (one per dataset).
- manage_ticksbool, default: True
If True, the tick locations and labels will be adjusted to match the boxplot positions.
- autorangebool, default: False
When True and the data are distributed such that the 25th and 75th percentiles are equal, whis is set to (0, 100) such that the whisker ends are at the minimum and maximum of the data.
- meanlinebool, default: False
If True (and showmeans is True), will try to render the mean as a line spanning the full width of the box according to meanprops (see below). Not recommended if shownotches is also True. Otherwise, means will be shown as points.
- zorderfloat, default:
Line2D.zorder = 2 The zorder of the boxplot.
Returns
- dict
A dictionary mapping each component of the boxplot to a list of the .Line2D instances created. That dictionary has the following keys (assuming vertical boxplots):
boxes: the main body of the boxplot showing the quartiles and the median’s confidence intervals if enabled.medians: horizontal lines at the median of each box.whiskers: the vertical lines extending to the most extreme, non-outlier data points.caps: the horizontal lines at the ends of the whiskers.fliers: points representing data that extend beyond the whiskers (fliers).means: points or lines representing the means.
Other Parameters
- showcapsbool, default: True
Show the caps on the ends of whiskers.
- showboxbool, default: True
Show the central box.
- showfliersbool, default: True
Show the outliers beyond the caps.
- showmeansbool, default: False
Show the arithmetic means.
- cappropsdict, default: None
The style of the caps.
- capwidthsfloat or array, default: None
The widths of the caps.
- boxpropsdict, default: None
The style of the box.
- whiskerpropsdict, default: None
The style of the whiskers.
- flierpropsdict, default: None
The style of the fliers.
- medianpropsdict, default: None
The style of the median.
- meanpropsdict, default: None
The style of the mean.
- dataindexable object, optional
If given, all parameters also accept a string
s, which is interpreted asdata[s](unless this raises an exception).
See Also
violinplot : Draw an estimate of the probability density function.
- broken_barh(xranges, yrange, *, data=None, **kwargs)[source]
Plot a horizontal sequence of rectangles.
A rectangle is drawn for each element of xranges. All rectangles have the same vertical position and size defined by yrange.
This is a convenience function for instantiating a .BrokenBarHCollection, adding it to the Axes and autoscaling the view.
Parameters
- xrangessequence of tuples (xmin, xwidth)
The x-positions and extends of the rectangles. For each tuple (xmin, xwidth) a rectangle is drawn from xmin to xmin + xwidth.
- yrange(ymin, yheight)
The y-position and extend for all the rectangles.
Returns
~.collections.BrokenBarHCollection
Other Parameters
- dataindexable object, optional
If given, all parameters also accept a string
s, which is interpreted asdata[s](unless this raises an exception).
**kwargs : .BrokenBarHCollection properties
Each kwarg can be either a single argument applying to all rectangles, e.g.:
facecolors='black'
or a sequence of arguments over which is cycled, e.g.:
facecolors=('black', 'blue')
would create interleaving black and blue rectangles.
Supported keywords:
Properties: agg_filter: a filter function, which takes a (m, n, 3) float array and a dpi value, and returns a (m, n, 3) array and two offsets from the bottom left corner of the image alpha: array-like or scalar or None animated: bool antialiased or aa or antialiaseds: bool or list of bools array: array-like or None capstyle: .CapStyle or {‘butt’, ‘projecting’, ‘round’} clim: (vmin: float, vmax: float) clip_box: .Bbox clip_on: bool clip_path: Patch or (Path, Transform) or None cmap: .Colormap or str or None color: color or list of rgba tuples edgecolor or ec or edgecolors: color or list of colors or ‘face’ facecolor or facecolors or fc: color or list of colors figure: .Figure gid: str hatch: {‘/’, ‘\’, ‘|’, ‘-’, ‘+’, ‘x’, ‘o’, ‘O’, ‘.’, ‘*’} in_layout: bool joinstyle: .JoinStyle or {‘miter’, ‘round’, ‘bevel’} label: object linestyle or dashes or linestyles or ls: str or tuple or list thereof linewidth or linewidths or lw: float or list of floats mouseover: bool norm: .Normalize or str or None offset_transform or transOffset: unknown offsets: (N, 2) or (2,) array-like path_effects: .AbstractPathEffect paths: list of array-like picker: None or bool or float or callable pickradius: unknown rasterized: bool sizes: ndarray or None sketch_params: (scale: float, length: float, randomness: float) snap: bool or None transform: .Transform url: str urls: list of str or None verts: list of array-like verts_and_codes: unknown visible: bool zorder: float
- bxp(bxpstats, positions=None, widths=None, vert=True, patch_artist=False, shownotches=False, showmeans=False, showcaps=True, showbox=True, showfliers=True, boxprops=None, whiskerprops=None, flierprops=None, medianprops=None, capprops=None, meanprops=None, meanline=False, manage_ticks=True, zorder=None, capwidths=None)[source]
Drawing function for box and whisker plots.
Make a box and whisker plot for each column of x or each vector in sequence x. The box extends from the lower to upper quartile values of the data, with a line at the median. The whiskers extend from the box to show the range of the data. Flier points are those past the end of the whiskers.
Parameters
- bxpstatslist of dicts
A list of dictionaries containing stats for each boxplot. Required keys are:
med: Median (scalar).q1,q3: First & third quartiles (scalars).whislo,whishi: Lower & upper whisker positions (scalars).
Optional keys are:
mean: Mean (scalar). Needed ifshowmeans=True.fliers: Data beyond the whiskers (array-like). Needed ifshowfliers=True.cilo,cihi: Lower & upper confidence intervals about the median. Needed ifshownotches=True.label: Name of the dataset (str). If available, this will be used a tick label for the boxplot
- positionsarray-like, default: [1, 2, …, n]
The positions of the boxes. The ticks and limits are automatically set to match the positions.
- widthsfloat or array-like, default: None
The widths of the boxes. The default is
clip(0.15*(distance between extreme positions), 0.15, 0.5).- capwidthsfloat or array-like, default: None
Either a scalar or a vector and sets the width of each cap. The default is
0.5*(with of the box), see widths.- vertbool, default: True
If True (default), makes the boxes vertical. If False, makes horizontal boxes.
- patch_artistbool, default: False
If False produces boxes with the .Line2D artist. If True produces boxes with the ~matplotlib.patches.Patch artist.
- shownotches, showmeans, showcaps, showbox, showfliersbool
Whether to draw the CI notches, the mean value (both default to False), the caps, the box, and the fliers (all three default to True).
- boxprops, whiskerprops, capprops, flierprops, medianprops, meanpropsdict, optional
Artist properties for the boxes, whiskers, caps, fliers, medians, and means.
- meanlinebool, default: False
If True (and showmeans is True), will try to render the mean as a line spanning the full width of the box according to meanprops. Not recommended if shownotches is also True. Otherwise, means will be shown as points.
- manage_ticksbool, default: True
If True, the tick locations and labels will be adjusted to match the boxplot positions.
- zorderfloat, default:
Line2D.zorder = 2 The zorder of the resulting boxplot.
Returns
- dict
A dictionary mapping each component of the boxplot to a list of the .Line2D instances created. That dictionary has the following keys (assuming vertical boxplots):
boxes: main bodies of the boxplot showing the quartiles, and the median’s confidence intervals if enabled.medians: horizontal lines at the median of each box.whiskers: vertical lines up to the last non-outlier data.caps: horizontal lines at the ends of the whiskers.fliers: points representing data beyond the whiskers (fliers).means: points or lines representing the means.
Examples
- can_pan()
Return whether this Axes supports any pan/zoom button functionality.
- can_zoom()
Return whether this Axes supports the zoom box button functionality.
- cla()
Clear the Axes.
- clabel(CS, levels=None, **kwargs)[source]
Label a contour plot.
Adds labels to line contours in given .ContourSet.
Parameters
- CS.ContourSet instance
Line contours to label.
- levelsarray-like, optional
A list of level values, that should be labeled. The list must be a subset of
CS.levels. If not given, all levels are labeled.- **kwargs
All other parameters are documented in ~.ContourLabeler.clabel.
- clear()
Clear the Axes.
- cohere(x, y, NFFT=256, Fs=2, Fc=0, detrend=<function detrend_none>, window=<function window_hanning>, noverlap=0, pad_to=None, sides='default', scale_by_freq=None, *, data=None, **kwargs)[source]
Plot the coherence between x and y.
Coherence is the normalized cross spectral density:
\[C_{xy} = \frac{|P_{xy}|^2}{P_{xx}P_{yy}}\]Parameters
- Fsfloat, default: 2
The sampling frequency (samples per time unit). It is used to calculate the Fourier frequencies, freqs, in cycles per time unit.
- windowcallable or ndarray, default: .window_hanning
A function or a vector of length NFFT. To create window vectors see .window_hanning, .window_none, numpy.blackman, numpy.hamming, numpy.bartlett, scipy.signal, scipy.signal.get_window, etc. If a function is passed as the argument, it must take a data segment as an argument and return the windowed version of the segment.
- sides{‘default’, ‘onesided’, ‘twosided’}, optional
Which sides of the spectrum to return. ‘default’ is one-sided for real data and two-sided for complex data. ‘onesided’ forces the return of a one-sided spectrum, while ‘twosided’ forces two-sided.
- pad_toint, optional
The number of points to which the data segment is padded when performing the FFT. This can be different from NFFT, which specifies the number of data points used. While not increasing the actual resolution of the spectrum (the minimum distance between resolvable peaks), this can give more points in the plot, allowing for more detail. This corresponds to the n parameter in the call to ~numpy.fft.fft. The default is None, which sets pad_to equal to NFFT
- NFFTint, default: 256
The number of data points used in each block for the FFT. A power 2 is most efficient. This should NOT be used to get zero padding, or the scaling of the result will be incorrect; use pad_to for this instead.
- detrend{‘none’, ‘mean’, ‘linear’} or callable, default: ‘none’
The function applied to each segment before fft-ing, designed to remove the mean or linear trend. Unlike in MATLAB, where the detrend parameter is a vector, in Matplotlib it is a function. The
mlabmodule defines .detrend_none, .detrend_mean, and .detrend_linear, but you can use a custom function as well. You can also use a string to choose one of the functions: ‘none’ calls .detrend_none. ‘mean’ calls .detrend_mean. ‘linear’ calls .detrend_linear.- scale_by_freqbool, default: True
Whether the resulting density values should be scaled by the scaling frequency, which gives density in units of 1/Hz. This allows for integration over the returned frequency values. The default is True for MATLAB compatibility.
- noverlapint, default: 0 (no overlap)
The number of points of overlap between blocks.
- Fcint, default: 0
The center frequency of x, which offsets the x extents of the plot to reflect the frequency range used when a signal is acquired and then filtered and downsampled to baseband.
Returns
- Cxy1-D array
The coherence vector.
- freqs1-D array
The frequencies for the elements in Cxy.
Other Parameters
- dataindexable object, optional
If given, the following parameters also accept a string
s, which is interpreted asdata[s](unless this raises an exception):x, y
- **kwargs
Keyword arguments control the .Line2D properties:
Properties: agg_filter: a filter function, which takes a (m, n, 3) float array and a dpi value, and returns a (m, n, 3) array and two offsets from the bottom left corner of the image alpha: scalar or None animated: bool antialiased or aa: bool clip_box: .Bbox clip_on: bool clip_path: Patch or (Path, Transform) or None color or c: color dash_capstyle: .CapStyle or {‘butt’, ‘projecting’, ‘round’} dash_joinstyle: .JoinStyle or {‘miter’, ‘round’, ‘bevel’} dashes: sequence of floats (on/off ink in points) or (None, None) data: (2, N) array or two 1D arrays drawstyle or ds: {‘default’, ‘steps’, ‘steps-pre’, ‘steps-mid’, ‘steps-post’}, default: ‘default’ figure: .Figure fillstyle: {‘full’, ‘left’, ‘right’, ‘bottom’, ‘top’, ‘none’} gapcolor: color or None gid: str in_layout: bool label: object linestyle or ls: {‘-’, ‘–’, ‘-.’, ‘:’, ‘’, (offset, on-off-seq), …} linewidth or lw: float marker: marker style string, ~.path.Path or ~.markers.MarkerStyle markeredgecolor or mec: color markeredgewidth or mew: float markerfacecolor or mfc: color markerfacecoloralt or mfcalt: color markersize or ms: float markevery: None or int or (int, int) or slice or list[int] or float or (float, float) or list[bool] mouseover: bool path_effects: .AbstractPathEffect picker: float or callable[[Artist, Event], tuple[bool, dict]] pickradius: unknown rasterized: bool sketch_params: (scale: float, length: float, randomness: float) snap: bool or None solid_capstyle: .CapStyle or {‘butt’, ‘projecting’, ‘round’} solid_joinstyle: .JoinStyle or {‘miter’, ‘round’, ‘bevel’} transform: unknown url: str visible: bool xdata: 1D array ydata: 1D array zorder: float
References
Bendat & Piersol – Random Data: Analysis and Measurement Procedures, John Wiley & Sons (1986)
- contains(mouseevent)
Test whether the artist contains the mouse event.
Parameters
mouseevent : matplotlib.backend_bases.MouseEvent
Returns
- containsbool
Whether any values are within the radius.
- detailsdict
An artist-specific dictionary of details of the event context, such as which points are contained in the pick radius. See the individual Artist subclasses for details.
- contains_point(point)
Return whether point (pair of pixel coordinates) is inside the Axes patch.
- contour(*args, data=None, **kwargs)[source]
Plot contour lines.
Call signature:
contour([X, Y,] Z, [levels], **kwargs)
.contour and .contourf draw contour lines and filled contours, respectively. Except as noted, function signatures and return values are the same for both versions.
Parameters
- X, Yarray-like, optional
The coordinates of the values in Z.
X and Y must both be 2D with the same shape as Z (e.g. created via numpy.meshgrid), or they must both be 1-D such that
len(X) == Nis the number of columns in Z andlen(Y) == Mis the number of rows in Z.X and Y must both be ordered monotonically.
If not given, they are assumed to be integer indices, i.e.
X = range(N),Y = range(M).- Z(M, N) array-like
The height values over which the contour is drawn. Color-mapping is controlled by cmap, norm, vmin, and vmax.
- levelsint or array-like, optional
Determines the number and positions of the contour lines / regions.
If an int n, use ~matplotlib.ticker.MaxNLocator, which tries to automatically choose no more than n+1 “nice” contour levels between minimum and maximum numeric values of Z.
If array-like, draw contour lines at the specified levels. The values must be in increasing order.
Returns
~.contour.QuadContourSet
Other Parameters
- corner_maskbool, default: :rc:`contour.corner_mask`
Enable/disable corner masking, which only has an effect if Z is a masked array. If
False, any quad touching a masked point is masked out. IfTrue, only the triangular corners of quads nearest those points are always masked out, other triangular corners comprising three unmasked points are contoured as usual.- colorscolor string or sequence of colors, optional
The colors of the levels, i.e. the lines for .contour and the areas for .contourf.
The sequence is cycled for the levels in ascending order. If the sequence is shorter than the number of levels, it’s repeated.
As a shortcut, single color strings may be used in place of one-element lists, i.e.
'red'instead of['red']to color all levels with the same color. This shortcut does only work for color strings, not for other ways of specifying colors.By default (value None), the colormap specified by cmap will be used.
- alphafloat, default: 1
The alpha blending value, between 0 (transparent) and 1 (opaque).
- cmapstr or ~matplotlib.colors.Colormap, default: :rc:`image.cmap`
The Colormap instance or registered colormap name used to map scalar data to colors.
This parameter is ignored if colors is set.
- normstr or ~matplotlib.colors.Normalize, optional
The normalization method used to scale scalar data to the [0, 1] range before mapping to colors using cmap. By default, a linear scaling is used, mapping the lowest value to 0 and the highest to 1.
If given, this can be one of the following:
An instance of .Normalize or one of its subclasses (see /tutorials/colors/colormapnorms).
A scale name, i.e. one of “linear”, “log”, “symlog”, “logit”, etc. For a list of available scales, call matplotlib.scale.get_scale_names(). In that case, a suitable .Normalize subclass is dynamically generated and instantiated.
This parameter is ignored if colors is set.
- vmin, vmaxfloat, optional
When using scalar data and no explicit norm, vmin and vmax define the data range that the colormap covers. By default, the colormap covers the complete value range of the supplied data. It is an error to use vmin/vmax when a norm instance is given (but using a str norm name together with vmin/vmax is acceptable).
If vmin or vmax are not given, the default color scaling is based on levels.
This parameter is ignored if colors is set.
- origin{None, ‘upper’, ‘lower’, ‘image’}, default: None
Determines the orientation and exact position of Z by specifying the position of
Z[0, 0]. This is only relevant, if X, Y are not given.None:
Z[0, 0]is at X=0, Y=0 in the lower left corner.‘lower’:
Z[0, 0]is at X=0.5, Y=0.5 in the lower left corner.‘upper’:
Z[0, 0]is at X=N+0.5, Y=0.5 in the upper left corner.‘image’: Use the value from :rc:`image.origin`.
- extent(x0, x1, y0, y1), optional
If origin is not None, then extent is interpreted as in .imshow: it gives the outer pixel boundaries. In this case, the position of Z[0, 0] is the center of the pixel, not a corner. If origin is None, then (x0, y0) is the position of Z[0, 0], and (x1, y1) is the position of Z[-1, -1].
This argument is ignored if X and Y are specified in the call to contour.
- locatorticker.Locator subclass, optional
The locator is used to determine the contour levels if they are not given explicitly via levels. Defaults to ~.ticker.MaxNLocator.
- extend{‘neither’, ‘both’, ‘min’, ‘max’}, default: ‘neither’
Determines the
contourf-coloring of values that are outside the levels range.If ‘neither’, values outside the levels range are not colored. If ‘min’, ‘max’ or ‘both’, color the values below, above or below and above the levels range.
Values below
min(levels)and abovemax(levels)are mapped to the under/over values of the .Colormap. Note that most colormaps do not have dedicated colors for these by default, so that the over and under values are the edge values of the colormap. You may want to set these values explicitly using .Colormap.set_under and .Colormap.set_over.Note
An existing .QuadContourSet does not get notified if properties of its colormap are changed. Therefore, an explicit call .QuadContourSet.changed() is needed after modifying the colormap. The explicit call can be left out, if a colorbar is assigned to the .QuadContourSet because it internally calls .QuadContourSet.changed().
Example:
x = np.arange(1, 10)
y = x.reshape(-1, 1)
h = x * y

cs = plt.contourf(h, levels=[10, 30, 50],
    colors=['#808080', '#A0A0A0', '#C0C0C0'], extend='both')
cs.cmap.set_over('red')
cs.cmap.set_under('blue')
cs.changed()
- xunits, yunitsregistered units, optional
Override axis units by specifying an instance of a
matplotlib.units.ConversionInterface.- antialiasedbool, optional
Enable antialiasing, overriding the defaults. For filled contours, the default is True. For line contours, it is taken from :rc:`lines.antialiased`.
- nchunkint >= 0, optional
If 0, no subdivision of the domain. Specify a positive integer to divide the domain into subdomains of nchunk by nchunk quads. Chunking reduces the maximum length of polygons generated by the contouring algorithm which reduces the rendering workload passed on to the backend and also requires slightly less RAM. It can however introduce rendering artifacts at chunk boundaries depending on the backend, the antialiased flag and value of alpha.
- linewidthsfloat or array-like, default: :rc:`contour.linewidth`
Only applies to .contour.
The line width of the contour lines.
If a number, all levels will be plotted with this linewidth.
If a sequence, the levels in ascending order will be plotted with the linewidths in the order specified.
If None, this falls back to :rc:`lines.linewidth`.
- linestyles{None, ‘solid’, ‘dashed’, ‘dashdot’, ‘dotted’}, optional
Only applies to .contour.
If linestyles is None, the default is ‘solid’ unless the lines are monochrome. In that case, negative contours will instead take their linestyle from the negative_linestyles argument.
linestyles can also be an iterable of the above strings specifying a set of linestyles to be used. If this iterable is shorter than the number of contour levels it will be repeated as necessary.
- negative_linestyles{None, ‘solid’, ‘dashed’, ‘dashdot’, ‘dotted’}, optional
Only applies to .contour.
If linestyles is None and the lines are monochrome, this argument specifies the line style for negative contours.
If negative_linestyles is None, the default is taken from :rc:`contour.negative_linestyles`.
negative_linestyles can also be an iterable of the above strings specifying a set of linestyles to be used. If this iterable is shorter than the number of contour levels it will be repeated as necessary.
- hatcheslist[str], optional
Only applies to .contourf.
A list of cross hatch patterns to use on the filled areas. If None, no hatching will be added to the contour. Hatching is supported in the PostScript, PDF, SVG and Agg backends only.
- algorithm{‘mpl2005’, ‘mpl2014’, ‘serial’, ‘threaded’}, optional
Which contouring algorithm to use to calculate the contour lines and polygons. The algorithms are implemented in ContourPy, consult the ContourPy documentation for further information.
The default is taken from :rc:`contour.algorithm`.
- dataindexable object, optional
If given, all parameters also accept a string
s, which is interpreted asdata[s](unless this raises an exception).
Notes
.contourf differs from the MATLAB version in that it does not draw the polygon edges. To draw edges, add line contours with calls to .contour.
.contourf fills intervals that are closed at the top; that is, for boundaries z1 and z2, the filled region is:
z1 < Z <= z2
except for the lowest interval, which is closed on both sides (i.e. it includes the lowest value).
.contour and .contourf use a marching squares algorithm to compute contour locations. More information can be found in ContourPy documentation.
- contourf(*args, data=None, **kwargs)[source]
Plot filled contours.
Call signature:
contourf([X, Y,] Z, [levels], **kwargs)
.contour and .contourf draw contour lines and filled contours, respectively. Except as noted, function signatures and return values are the same for both versions.
Parameters
- X, Yarray-like, optional
The coordinates of the values in Z.
X and Y must both be 2D with the same shape as Z (e.g. created via numpy.meshgrid), or they must both be 1-D such that
len(X) == Nis the number of columns in Z andlen(Y) == Mis the number of rows in Z.X and Y must both be ordered monotonically.
If not given, they are assumed to be integer indices, i.e.
X = range(N),Y = range(M).- Z(M, N) array-like
The height values over which the contour is drawn. Color-mapping is controlled by cmap, norm, vmin, and vmax.
- levelsint or array-like, optional
Determines the number and positions of the contour lines / regions.
If an int n, use ~matplotlib.ticker.MaxNLocator, which tries to automatically choose no more than n+1 “nice” contour levels between minimum and maximum numeric values of Z.
If array-like, draw contour lines at the specified levels. The values must be in increasing order.
Returns
~.contour.QuadContourSet
Other Parameters
- corner_maskbool, default: :rc:`contour.corner_mask`
Enable/disable corner masking, which only has an effect if Z is a masked array. If
False, any quad touching a masked point is masked out. IfTrue, only the triangular corners of quads nearest those points are always masked out, other triangular corners comprising three unmasked points are contoured as usual.- colorscolor string or sequence of colors, optional
The colors of the levels, i.e. the lines for .contour and the areas for .contourf.
The sequence is cycled for the levels in ascending order. If the sequence is shorter than the number of levels, it’s repeated.
As a shortcut, single color strings may be used in place of one-element lists, i.e.
'red'instead of['red']to color all levels with the same color. This shortcut does only work for color strings, not for other ways of specifying colors.By default (value None), the colormap specified by cmap will be used.
- alphafloat, default: 1
The alpha blending value, between 0 (transparent) and 1 (opaque).
- cmapstr or ~matplotlib.colors.Colormap, default: :rc:`image.cmap`
The Colormap instance or registered colormap name used to map scalar data to colors.
This parameter is ignored if colors is set.
- normstr or ~matplotlib.colors.Normalize, optional
The normalization method used to scale scalar data to the [0, 1] range before mapping to colors using cmap. By default, a linear scaling is used, mapping the lowest value to 0 and the highest to 1.
If given, this can be one of the following:
An instance of .Normalize or one of its subclasses (see /tutorials/colors/colormapnorms).
A scale name, i.e. one of “linear”, “log”, “symlog”, “logit”, etc. For a list of available scales, call matplotlib.scale.get_scale_names(). In that case, a suitable .Normalize subclass is dynamically generated and instantiated.
This parameter is ignored if colors is set.
- vmin, vmaxfloat, optional
When using scalar data and no explicit norm, vmin and vmax define the data range that the colormap covers. By default, the colormap covers the complete value range of the supplied data. It is an error to use vmin/vmax when a norm instance is given (but using a str norm name together with vmin/vmax is acceptable).
If vmin or vmax are not given, the default color scaling is based on levels.
This parameter is ignored if colors is set.
- origin{None, ‘upper’, ‘lower’, ‘image’}, default: None
Determines the orientation and exact position of Z by specifying the position of
Z[0, 0]. This is only relevant, if X, Y are not given.None:
Z[0, 0]is at X=0, Y=0 in the lower left corner.‘lower’:
Z[0, 0]is at X=0.5, Y=0.5 in the lower left corner.‘upper’:
Z[0, 0]is at X=N+0.5, Y=0.5 in the upper left corner.‘image’: Use the value from :rc:`image.origin`.
- extent(x0, x1, y0, y1), optional
If origin is not None, then extent is interpreted as in .imshow: it gives the outer pixel boundaries. In this case, the position of Z[0, 0] is the center of the pixel, not a corner. If origin is None, then (x0, y0) is the position of Z[0, 0], and (x1, y1) is the position of Z[-1, -1].
This argument is ignored if X and Y are specified in the call to contour.
- locatorticker.Locator subclass, optional
The locator is used to determine the contour levels if they are not given explicitly via levels. Defaults to ~.ticker.MaxNLocator.
- extend{‘neither’, ‘both’, ‘min’, ‘max’}, default: ‘neither’
Determines the
contourf-coloring of values that are outside the levels range.If ‘neither’, values outside the levels range are not colored. If ‘min’, ‘max’ or ‘both’, color the values below, above or below and above the levels range.
Values below
min(levels)and abovemax(levels)are mapped to the under/over values of the .Colormap. Note that most colormaps do not have dedicated colors for these by default, so that the over and under values are the edge values of the colormap. You may want to set these values explicitly using .Colormap.set_under and .Colormap.set_over.Note
An existing .QuadContourSet does not get notified if properties of its colormap are changed. Therefore, an explicit call .QuadContourSet.changed() is needed after modifying the colormap. The explicit call can be left out, if a colorbar is assigned to the .QuadContourSet because it internally calls .QuadContourSet.changed().
Example:
x = np.arange(1, 10)
y = x.reshape(-1, 1)
h = x * y

cs = plt.contourf(h, levels=[10, 30, 50],
    colors=['#808080', '#A0A0A0', '#C0C0C0'], extend='both')
cs.cmap.set_over('red')
cs.cmap.set_under('blue')
cs.changed()
- xunits, yunitsregistered units, optional
Override axis units by specifying an instance of a
matplotlib.units.ConversionInterface.- antialiasedbool, optional
Enable antialiasing, overriding the defaults. For filled contours, the default is True. For line contours, it is taken from :rc:`lines.antialiased`.
- nchunkint >= 0, optional
If 0, no subdivision of the domain. Specify a positive integer to divide the domain into subdomains of nchunk by nchunk quads. Chunking reduces the maximum length of polygons generated by the contouring algorithm which reduces the rendering workload passed on to the backend and also requires slightly less RAM. It can however introduce rendering artifacts at chunk boundaries depending on the backend, the antialiased flag and value of alpha.
- linewidthsfloat or array-like, default: :rc:`contour.linewidth`
Only applies to .contour.
The line width of the contour lines.
If a number, all levels will be plotted with this linewidth.
If a sequence, the levels in ascending order will be plotted with the linewidths in the order specified.
If None, this falls back to :rc:`lines.linewidth`.
- linestyles{None, ‘solid’, ‘dashed’, ‘dashdot’, ‘dotted’}, optional
Only applies to .contour.
If linestyles is None, the default is ‘solid’ unless the lines are monochrome. In that case, negative contours will instead take their linestyle from the negative_linestyles argument.
linestyles can also be an iterable of the above strings specifying a set of linestyles to be used. If this iterable is shorter than the number of contour levels it will be repeated as necessary.
- negative_linestyles{None, ‘solid’, ‘dashed’, ‘dashdot’, ‘dotted’}, optional
Only applies to .contour.
If linestyles is None and the lines are monochrome, this argument specifies the line style for negative contours.
If negative_linestyles is None, the default is taken from :rc:`contour.negative_linestyles`.
negative_linestyles can also be an iterable of the above strings specifying a set of linestyles to be used. If this iterable is shorter than the number of contour levels it will be repeated as necessary.
- hatcheslist[str], optional
Only applies to .contourf.
A list of cross hatch patterns to use on the filled areas. If None, no hatching will be added to the contour. Hatching is supported in the PostScript, PDF, SVG and Agg backends only.
- algorithm{‘mpl2005’, ‘mpl2014’, ‘serial’, ‘threaded’}, optional
Which contouring algorithm to use to calculate the contour lines and polygons. The algorithms are implemented in ContourPy, consult the ContourPy documentation for further information.
The default is taken from :rc:`contour.algorithm`.
- dataindexable object, optional
If given, all parameters also accept a string
s, which is interpreted asdata[s](unless this raises an exception).
Notes
.contourf differs from the MATLAB version in that it does not draw the polygon edges. To draw edges, add line contours with calls to .contour.
.contourf fills intervals that are closed at the top; that is, for boundaries z1 and z2, the filled region is:
z1 < Z <= z2
except for the lowest interval, which is closed on both sides (i.e. it includes the lowest value).
.contour and .contourf use a marching squares algorithm to compute contour locations. More information can be found in ContourPy documentation.
- convert_xunits(x)
Convert x using the unit type of the xaxis.
If the artist is not contained in an Axes or if the xaxis does not have units, x itself is returned.
- convert_yunits(y)
Convert y using the unit type of the yaxis.
If the artist is not contained in an Axes or if the yaxis does not have units, y itself is returned.
- csd(x, y, NFFT=None, Fs=None, Fc=None, detrend=None, window=None, noverlap=None, pad_to=None, sides=None, scale_by_freq=None, return_line=None, *, data=None, **kwargs)[source]
Plot the cross-spectral density.
The cross spectral density \(P_{xy}\) by Welch’s average periodogram method. The vectors x and y are divided into NFFT length segments. Each segment is detrended by function detrend and windowed by function window. noverlap gives the length of the overlap between segments. The product of the direct FFTs of x and y are averaged over each segment to compute \(P_{xy}\), with a scaling to correct for power loss due to windowing.
If len(x) < NFFT or len(y) < NFFT, they will be zero padded to NFFT.
Parameters
- x, y1-D arrays or sequences
Arrays or sequences containing the data.
- Fsfloat, default: 2
The sampling frequency (samples per time unit). It is used to calculate the Fourier frequencies, freqs, in cycles per time unit.
- windowcallable or ndarray, default: .window_hanning
A function or a vector of length NFFT. To create window vectors see .window_hanning, .window_none, numpy.blackman, numpy.hamming, numpy.bartlett, scipy.signal, scipy.signal.get_window, etc. If a function is passed as the argument, it must take a data segment as an argument and return the windowed version of the segment.
- sides{‘default’, ‘onesided’, ‘twosided’}, optional
Which sides of the spectrum to return. ‘default’ is one-sided for real data and two-sided for complex data. ‘onesided’ forces the return of a one-sided spectrum, while ‘twosided’ forces two-sided.
- pad_toint, optional
The number of points to which the data segment is padded when performing the FFT. This can be different from NFFT, which specifies the number of data points used. While not increasing the actual resolution of the spectrum (the minimum distance between resolvable peaks), this can give more points in the plot, allowing for more detail. This corresponds to the n parameter in the call to ~numpy.fft.fft. The default is None, which sets pad_to equal to NFFT
- NFFTint, default: 256
The number of data points used in each block for the FFT. A power 2 is most efficient. This should NOT be used to get zero padding, or the scaling of the result will be incorrect; use pad_to for this instead.
- detrend{‘none’, ‘mean’, ‘linear’} or callable, default: ‘none’
The function applied to each segment before fft-ing, designed to remove the mean or linear trend. Unlike in MATLAB, where the detrend parameter is a vector, in Matplotlib it is a function. The
mlabmodule defines .detrend_none, .detrend_mean, and .detrend_linear, but you can use a custom function as well. You can also use a string to choose one of the functions: ‘none’ calls .detrend_none. ‘mean’ calls .detrend_mean. ‘linear’ calls .detrend_linear.- scale_by_freqbool, default: True
Whether the resulting density values should be scaled by the scaling frequency, which gives density in units of 1/Hz. This allows for integration over the returned frequency values. The default is True for MATLAB compatibility.
- noverlapint, default: 0 (no overlap)
The number of points of overlap between segments.
- Fcint, default: 0
The center frequency of x, which offsets the x extents of the plot to reflect the frequency range used when a signal is acquired and then filtered and downsampled to baseband.
- return_linebool, default: False
Whether to include the line object plotted in the returned values.
Returns
- Pxy1-D array
The values for the cross spectrum \(P_{xy}\) before scaling (complex valued).
- freqs1-D array
The frequencies corresponding to the elements in Pxy.
- line~matplotlib.lines.Line2D
The line created by this function. Only returned if return_line is True.
Other Parameters
- dataindexable object, optional
If given, the following parameters also accept a string
s, which is interpreted asdata[s](unless this raises an exception):x, y
- **kwargs
Keyword arguments control the .Line2D properties:
Properties: agg_filter: a filter function, which takes a (m, n, 3) float array and a dpi value, and returns a (m, n, 3) array and two offsets from the bottom left corner of the image alpha: scalar or None animated: bool antialiased or aa: bool clip_box: .Bbox clip_on: bool clip_path: Patch or (Path, Transform) or None color or c: color dash_capstyle: .CapStyle or {‘butt’, ‘projecting’, ‘round’} dash_joinstyle: .JoinStyle or {‘miter’, ‘round’, ‘bevel’} dashes: sequence of floats (on/off ink in points) or (None, None) data: (2, N) array or two 1D arrays drawstyle or ds: {‘default’, ‘steps’, ‘steps-pre’, ‘steps-mid’, ‘steps-post’}, default: ‘default’ figure: .Figure fillstyle: {‘full’, ‘left’, ‘right’, ‘bottom’, ‘top’, ‘none’} gapcolor: color or None gid: str in_layout: bool label: object linestyle or ls: {‘-’, ‘–’, ‘-.’, ‘:’, ‘’, (offset, on-off-seq), …} linewidth or lw: float marker: marker style string, ~.path.Path or ~.markers.MarkerStyle markeredgecolor or mec: color markeredgewidth or mew: float markerfacecolor or mfc: color markerfacecoloralt or mfcalt: color markersize or ms: float markevery: None or int or (int, int) or slice or list[int] or float or (float, float) or list[bool] mouseover: bool path_effects: .AbstractPathEffect picker: float or callable[[Artist, Event], tuple[bool, dict]] pickradius: unknown rasterized: bool sketch_params: (scale: float, length: float, randomness: float) snap: bool or None solid_capstyle: .CapStyle or {‘butt’, ‘projecting’, ‘round’} solid_joinstyle: .JoinStyle or {‘miter’, ‘round’, ‘bevel’} transform: unknown url: str visible: bool xdata: 1D array ydata: 1D array zorder: float
See Also
psd : is equivalent to setting
y = x.Notes
For plotting, the power is plotted as \(10 \log_{10}(P_{xy})\) for decibels, though \(P_{xy}\) itself is returned.
References
Bendat & Piersol – Random Data: Analysis and Measurement Procedures, John Wiley & Sons (1986)
- drag_pan(button, key, x, y)
Called when the mouse moves during a pan operation.
Parameters
- button.MouseButton
The pressed mouse button.
- keystr or None
The pressed key, if any.
- x, yfloat
The mouse coordinates in display coords.
Notes
This is intended to be overridden by new projection types.
- draw(renderer)
Draw the Artist (and its children) using the given renderer.
This has no effect if the artist is not visible (.Artist.get_visible returns False).
Parameters
renderer : .RendererBase subclass.
Notes
This method is overridden in the Artist subclasses.
- draw_artist(a)
Efficiently redraw a single artist.
- end_pan()
Called when a pan operation completes (when the mouse button is up.)
Notes
This is intended to be overridden by new projection types.
- errorbar(x, y, yerr=None, xerr=None, fmt='', ecolor=None, elinewidth=None, capsize=None, barsabove=False, lolims=False, uplims=False, xlolims=False, xuplims=False, errorevery=1, capthick=None, *, data=None, **kwargs)[source]
Plot y versus x as lines and/or markers with attached errorbars.
x, y define the data locations, xerr, yerr define the errorbar sizes. By default, this draws the data markers/lines as well the errorbars. Use fmt=’none’ to draw errorbars without any data markers.
Parameters
- x, yfloat or array-like
The data positions.
- xerr, yerrfloat or array-like, shape(N,) or shape(2, N), optional
The errorbar sizes:
scalar: Symmetric +/- values for all data points.
shape(N,): Symmetric +/-values for each data point.
shape(2, N): Separate - and + values for each bar. First row contains the lower errors, the second row contains the upper errors.
None: No errorbar.
All values must be >= 0.
See /gallery/statistics/errorbar_features for an example on the usage of
xerrandyerr.- fmtstr, default: ‘’
The format for the data points / data lines. See .plot for details.
Use ‘none’ (case insensitive) to plot errorbars without any data markers.
- ecolorcolor, default: None
The color of the errorbar lines. If None, use the color of the line connecting the markers.
- elinewidthfloat, default: None
The linewidth of the errorbar lines. If None, the linewidth of the current style is used.
- capsizefloat, default: :rc:`errorbar.capsize`
The length of the error bar caps in points.
- capthickfloat, default: None
An alias to the keyword argument markeredgewidth (a.k.a. mew). This setting is a more sensible name for the property that controls the thickness of the error bar cap in points. For backwards compatibility, if mew or markeredgewidth are given, then they will over-ride capthick. This may change in future releases.
- barsabovebool, default: False
If True, will plot the errorbars above the plot symbols. Default is below.
- lolims, uplims, xlolims, xuplimsbool, default: False
These arguments can be used to indicate that a value gives only upper/lower limits. In that case a caret symbol is used to indicate this. lims-arguments may be scalars, or array-likes of the same length as xerr and yerr. To use limits with inverted axes, ~.Axes.set_xlim or ~.Axes.set_ylim must be called before
errorbar(). Note the tricky parameter names: setting e.g. lolims to True means that the y-value is a lower limit of the True value, so, only an upward-pointing arrow will be drawn!- erroreveryint or (int, int), default: 1
draws error bars on a subset of the data. errorevery =N draws error bars on the points (x[::N], y[::N]). errorevery =(start, N) draws error bars on the points (x[start::N], y[start::N]). e.g. errorevery=(6, 3) adds error bars to the data at (x[6], x[9], x[12], x[15], …). Used to avoid overlapping error bars when two series share x-axis values.
Returns
- .ErrorbarContainer
The container contains:
plotline: .Line2D instance of x, y plot markers and/or line.
caplines: A tuple of .Line2D instances of the error bar caps.
barlinecols: A tuple of .LineCollection with the horizontal and vertical error ranges.
Other Parameters
- dataindexable object, optional
If given, the following parameters also accept a string
s, which is interpreted asdata[s](unless this raises an exception):x, y, xerr, yerr
- **kwargs
All other keyword arguments are passed on to the ~.Axes.plot call drawing the markers. For example, this code makes big red squares with thick green edges:
x, y, yerr = rand(3, 10)
errorbar(x, y, yerr, marker='s', mfc='red',
         mec='green', ms=20, mew=4)
where mfc, mec, ms and mew are aliases for the longer property names, markerfacecolor, markeredgecolor, markersize and markeredgewidth.
Valid kwargs for the marker properties are:
dashes
dash_capstyle
dash_joinstyle
drawstyle
fillstyle
linestyle
marker
markeredgecolor
markeredgewidth
markerfacecolor
markerfacecoloralt
markersize
markevery
solid_capstyle
solid_joinstyle
Refer to the corresponding .Line2D property for more details:
Properties: agg_filter: a filter function, which takes a (m, n, 3) float array and a dpi value, and returns a (m, n, 3) array and two offsets from the bottom left corner of the image alpha: scalar or None animated: bool antialiased or aa: bool clip_box: .Bbox clip_on: bool clip_path: Patch or (Path, Transform) or None color or c: color dash_capstyle: .CapStyle or {‘butt’, ‘projecting’, ‘round’} dash_joinstyle: .JoinStyle or {‘miter’, ‘round’, ‘bevel’} dashes: sequence of floats (on/off ink in points) or (None, None) data: (2, N) array or two 1D arrays drawstyle or ds: {‘default’, ‘steps’, ‘steps-pre’, ‘steps-mid’, ‘steps-post’}, default: ‘default’ figure: .Figure fillstyle: {‘full’, ‘left’, ‘right’, ‘bottom’, ‘top’, ‘none’} gapcolor: color or None gid: str in_layout: bool label: object linestyle or ls: {‘-’, ‘–’, ‘-.’, ‘:’, ‘’, (offset, on-off-seq), …} linewidth or lw: float marker: marker style string, ~.path.Path or ~.markers.MarkerStyle markeredgecolor or mec: color markeredgewidth or mew: float markerfacecolor or mfc: color markerfacecoloralt or mfcalt: color markersize or ms: float markevery: None or int or (int, int) or slice or list[int] or float or (float, float) or list[bool] mouseover: bool path_effects: .AbstractPathEffect picker: float or callable[[Artist, Event], tuple[bool, dict]] pickradius: unknown rasterized: bool sketch_params: (scale: float, length: float, randomness: float) snap: bool or None solid_capstyle: .CapStyle or {‘butt’, ‘projecting’, ‘round’} solid_joinstyle: .JoinStyle or {‘miter’, ‘round’, ‘bevel’} transform: unknown url: str visible: bool xdata: 1D array ydata: 1D array zorder: float
- eventplot(positions, orientation='horizontal', lineoffsets=1, linelengths=1, linewidths=None, colors=None, linestyles='solid', *, data=None, **kwargs)[source]
Plot identical parallel lines at the given positions.
This type of plot is commonly used in neuroscience for representing neural events, where it is usually called a spike raster, dot raster, or raster plot.
However, it is useful in any situation where you wish to show the timing or position of multiple sets of discrete events, such as the arrival times of people to a business on each day of the month or the date of hurricanes each year of the last century.
Parameters
- positionsarray-like or list of array-like
A 1D array-like defines the positions of one sequence of events.
Multiple groups of events may be passed as a list of array-likes. Each group can be styled independently by passing lists of values to lineoffsets, linelengths, linewidths, colors and linestyles.
Note that positions can be a 2D array, but in practice different event groups usually have different counts so that one will use a list of different-length arrays rather than a 2D array.
- orientation{‘horizontal’, ‘vertical’}, default: ‘horizontal’
The direction of the event sequence:
‘horizontal’: the events are arranged horizontally. The indicator lines are vertical.
‘vertical’: the events are arranged vertically. The indicator lines are horizontal.
- lineoffsetsfloat or array-like, default: 1
The offset of the center of the lines from the origin, in the direction orthogonal to orientation.
If positions is 2D, this can be a sequence with length matching the length of positions.
- linelengthsfloat or array-like, default: 1
The total height of the lines (i.e. the lines stretches from
lineoffset - linelength/2tolineoffset + linelength/2).If positions is 2D, this can be a sequence with length matching the length of positions.
- linewidthsfloat or array-like, default: :rc:`lines.linewidth`
The line width(s) of the event lines, in points.
If positions is 2D, this can be a sequence with length matching the length of positions.
- colorscolor or list of colors, default: :rc:`lines.color`
The color(s) of the event lines.
If positions is 2D, this can be a sequence with length matching the length of positions.
- linestylesstr or tuple or list of such values, default: ‘solid’
Default is ‘solid’. Valid strings are [‘solid’, ‘dashed’, ‘dashdot’, ‘dotted’, ‘-’, ‘–’, ‘-.’, ‘:’]. Dash tuples should be of the form:
(offset, onoffseq),
where onoffseq is an even length tuple of on and off ink in points.
If positions is 2D, this can be a sequence with length matching the length of positions.
- dataindexable object, optional
If given, the following parameters also accept a string
s, which is interpreted asdata[s](unless this raises an exception):positions, lineoffsets, linelengths, linewidths, colors, linestyles
- **kwargs
Other keyword arguments are line collection properties. See .LineCollection for a list of the valid properties.
Returns
- list of .EventCollection
The .EventCollection that were added.
Notes
For linelengths, linewidths, colors, and linestyles, if only a single value is given, that value is applied to all lines. If an array-like is given, it must have the same length as positions, and each value will be applied to the corresponding row of the array.
Examples
- fill(*args, data=None, **kwargs)[source]
Plot filled polygons.
Parameters
- *argssequence of x, y, [color]
Each polygon is defined by the lists of x and y positions of its nodes, optionally followed by a color specifier. See
matplotlib.colorsfor supported color specifiers. The standard color cycle is used for polygons without a color specifier.You can plot multiple polygons by providing multiple x, y, [color] groups.
For example, each of the following is legal:
ax.fill(x, y)                    # a polygon with default color
ax.fill(x, y, "b")               # a blue polygon
ax.fill(x, y, x2, y2)            # two polygons
ax.fill(x, y, "b", x2, y2, "r")  # a blue and a red polygon
- dataindexable object, optional
An object with labelled data. If given, provide the label names to plot in x and y, e.g.:
ax.fill("time", "signal",
        data={"time": [0, 1, 2], "signal": [0, 1, 0]})
Returns
list of ~matplotlib.patches.Polygon
Other Parameters
**kwargs : ~matplotlib.patches.Polygon properties
Notes
Use
fill_between()if you would like to fill the region between two curves.
- fill_between(x, y1, y2=0, where=None, interpolate=False, step=None, *, data=None, **kwargs)[source]
Fill the area between two horizontal curves.
The curves are defined by the points (x, y1) and (x, y2). This creates one or multiple polygons describing the filled area.
You may exclude some horizontal sections from filling using where.
By default, the edges connect the given points directly. Use step if the filling should be a step function, i.e. constant in between x.
Parameters
- xarray (length N)
The x coordinates of the nodes defining the curves.
- y1array (length N) or scalar
The y coordinates of the nodes defining the first curve.
- y2array (length N) or scalar, default: 0
The y coordinates of the nodes defining the second curve.
- wherearray of bool (length N), optional
Define where to exclude some horizontal regions from being filled. The filled regions are defined by the coordinates
x[where]. More precisely, fill betweenx[i]andx[i+1]ifwhere[i] and where[i+1]. Note that this definition implies that an isolated True value between two False values in where will not result in filling. Both sides of the True position remain unfilled due to the adjacent False values.- interpolatebool, default: False
This option is only relevant if where is used and the two curves are crossing each other.
Semantically, where is often used for y1 > y2 or similar. By default, the nodes of the polygon defining the filled region will only be placed at the positions in the x array. Such a polygon cannot describe the above semantics close to the intersection. The x-sections containing the intersection are simply clipped.
Setting interpolate to True will calculate the actual intersection point and extend the filled region up to this point.
- step{‘pre’, ‘post’, ‘mid’}, optional
Define step if the filling should be a step function, i.e. constant in between x. The value determines where the step will occur:
‘pre’: The y value is continued constantly to the left from every x position, i.e. the interval
(x[i-1], x[i]]has the valuey[i].‘post’: The y value is continued constantly to the right from every x position, i.e. the interval
[x[i], x[i+1])has the valuey[i].‘mid’: Steps occur half-way between the x positions.
Returns
- .PolyCollection
A .PolyCollection containing the plotted polygons.
Other Parameters
- dataindexable object, optional
If given, the following parameters also accept a string
s, which is interpreted asdata[s](unless this raises an exception):x, y1, y2, where
- **kwargs
All other keyword arguments are passed on to .PolyCollection. They control the .Polygon properties:
Properties: agg_filter: a filter function, which takes a (m, n, 3) float array and a dpi value, and returns a (m, n, 3) array and two offsets from the bottom left corner of the image alpha: array-like or scalar or None animated: bool antialiased or aa or antialiaseds: bool or list of bools array: array-like or None capstyle: .CapStyle or {‘butt’, ‘projecting’, ‘round’} clim: (vmin: float, vmax: float) clip_box: .Bbox clip_on: bool clip_path: Patch or (Path, Transform) or None cmap: .Colormap or str or None color: color or list of rgba tuples edgecolor or ec or edgecolors: color or list of colors or ‘face’ facecolor or facecolors or fc: color or list of colors figure: .Figure gid: str hatch: {‘/’, ‘\’, ‘|’, ‘-’, ‘+’, ‘x’, ‘o’, ‘O’, ‘.’, ‘*’} in_layout: bool joinstyle: .JoinStyle or {‘miter’, ‘round’, ‘bevel’} label: object linestyle or dashes or linestyles or ls: str or tuple or list thereof linewidth or linewidths or lw: float or list of floats mouseover: bool norm: .Normalize or str or None offset_transform or transOffset: unknown offsets: (N, 2) or (2,) array-like path_effects: .AbstractPathEffect paths: list of array-like picker: None or bool or float or callable pickradius: unknown rasterized: bool sizes: ndarray or None sketch_params: (scale: float, length: float, randomness: float) snap: bool or None transform: .Transform url: str urls: list of str or None verts: list of array-like verts_and_codes: unknown visible: bool zorder: float
See Also
fill_between : Fill between two sets of y-values. fill_betweenx : Fill between two sets of x-values.
- fill_betweenx(y, x1, x2=0, where=None, step=None, interpolate=False, *, data=None, **kwargs)[source]
Fill the area between two vertical curves.
The curves are defined by the points (y, x1) and (y, x2). This creates one or multiple polygons describing the filled area.
You may exclude some vertical sections from filling using where.
By default, the edges connect the given points directly. Use step if the filling should be a step function, i.e. constant in between y.
Parameters
- yarray (length N)
The y coordinates of the nodes defining the curves.
- x1array (length N) or scalar
The x coordinates of the nodes defining the first curve.
- x2array (length N) or scalar, default: 0
The x coordinates of the nodes defining the second curve.
- wherearray of bool (length N), optional
Define where to exclude some vertical regions from being filled. The filled regions are defined by the coordinates
y[where]. More precisely, fill betweeny[i]andy[i+1]ifwhere[i] and where[i+1]. Note that this definition implies that an isolated True value between two False values in where will not result in filling. Both sides of the True position remain unfilled due to the adjacent False values.- interpolatebool, default: False
This option is only relevant if where is used and the two curves are crossing each other.
Semantically, where is often used for x1 > x2 or similar. By default, the nodes of the polygon defining the filled region will only be placed at the positions in the y array. Such a polygon cannot describe the above semantics close to the intersection. The y-sections containing the intersection are simply clipped.
Setting interpolate to True will calculate the actual intersection point and extend the filled region up to this point.
- step{‘pre’, ‘post’, ‘mid’}, optional
Define step if the filling should be a step function, i.e. constant in between y. The value determines where the step will occur:
‘pre’: The y value is continued constantly to the left from every x position, i.e. the interval
(x[i-1], x[i]]has the valuey[i].‘post’: The y value is continued constantly to the right from every x position, i.e. the interval
[x[i], x[i+1])has the valuey[i].‘mid’: Steps occur half-way between the x positions.
Returns
- .PolyCollection
A .PolyCollection containing the plotted polygons.
Other Parameters
- dataindexable object, optional
If given, the following parameters also accept a string
s, which is interpreted asdata[s](unless this raises an exception):y, x1, x2, where
- **kwargs
All other keyword arguments are passed on to .PolyCollection. They control the .Polygon properties:
Properties: agg_filter: a filter function, which takes a (m, n, 3) float array and a dpi value, and returns a (m, n, 3) array and two offsets from the bottom left corner of the image alpha: array-like or scalar or None animated: bool antialiased or aa or antialiaseds: bool or list of bools array: array-like or None capstyle: .CapStyle or {‘butt’, ‘projecting’, ‘round’} clim: (vmin: float, vmax: float) clip_box: .Bbox clip_on: bool clip_path: Patch or (Path, Transform) or None cmap: .Colormap or str or None color: color or list of rgba tuples edgecolor or ec or edgecolors: color or list of colors or ‘face’ facecolor or facecolors or fc: color or list of colors figure: .Figure gid: str hatch: {‘/’, ‘\’, ‘|’, ‘-’, ‘+’, ‘x’, ‘o’, ‘O’, ‘.’, ‘*’} in_layout: bool joinstyle: .JoinStyle or {‘miter’, ‘round’, ‘bevel’} label: object linestyle or dashes or linestyles or ls: str or tuple or list thereof linewidth or linewidths or lw: float or list of floats mouseover: bool norm: .Normalize or str or None offset_transform or transOffset: unknown offsets: (N, 2) or (2,) array-like path_effects: .AbstractPathEffect paths: list of array-like picker: None or bool or float or callable pickradius: unknown rasterized: bool sizes: ndarray or None sketch_params: (scale: float, length: float, randomness: float) snap: bool or None transform: .Transform url: str urls: list of str or None verts: list of array-like verts_and_codes: unknown visible: bool zorder: float
See Also
fill_between : Fill between two sets of y-values. fill_betweenx : Fill between two sets of x-values.
- findobj(match=None, include_self=True)
Find artist objects.
Recursively find all .Artist instances contained in the artist.
Parameters
- match
A filter criterion for the matches. This can be
None: Return all objects contained in artist.
A function with signature
def match(artist: Artist) -> bool. The result will only contain artists for which the function returns True.A class instance: e.g., .Line2D. The result will only contain artists of this class or its subclasses (
isinstancecheck).
- include_selfbool
Include self in the list to be checked for a match.
Returns
list of .Artist
- format_coord(x, y)
Return a format string formatting the x, y coordinates.
- format_cursor_data(data)
Return a string representation of data.
Note
This method is intended to be overridden by artist subclasses. As an end-user of Matplotlib you will most likely not call this method yourself.
The default implementation converts ints and floats and arrays of ints and floats into a comma-separated string enclosed in square brackets, unless the artist has an associated colorbar, in which case scalar values are formatted using the colorbar’s formatter.
See Also
get_cursor_data
- format_xdata(x)
Return x formatted as an x-value.
This function will use the .fmt_xdata attribute if it is not None, else will fall back on the xaxis major formatter.
- format_ydata(y)
Return y formatted as an y-value.
This function will use the .fmt_ydata attribute if it is not None, else will fall back on the yaxis major formatter.
- get_adjustable()
Return whether the Axes will adjust its physical dimension (‘box’) or its data limits (‘datalim’) to achieve the desired aspect ratio.
See Also
- matplotlib.axes.Axes.set_adjustable
Set how the Axes adjusts to achieve the required aspect ratio.
- matplotlib.axes.Axes.set_aspect
For a description of aspect handling.
- get_agg_filter()
Return filter function to be used for agg filter.
- get_alpha()
Return the alpha value used for blending - not supported on all backends.
- get_anchor()
Get the anchor location.
See Also
- matplotlib.axes.Axes.set_anchor
for a description of the anchor.
- matplotlib.axes.Axes.set_aspect
for a description of aspect handling.
- get_animated()
Return whether the artist is animated.
- get_aspect()
Return the aspect ratio of the axes scaling.
This is either “auto” or a float giving the ratio of y/x-scale.
- get_autoscale_on()
Return True if each axis is autoscaled, False otherwise.
- get_autoscalex_on()
Return whether the xaxis is autoscaled.
- get_autoscaley_on()
Return whether the yaxis is autoscaled.
- get_axes_locator()
Return the axes_locator.
- get_axisbelow()
Get whether axis ticks and gridlines are above or below most artists.
Returns
bool or ‘line’
See Also
set_axisbelow
- get_box_aspect()
Return the Axes box aspect, i.e. the ratio of height to width.
The box aspect is
None(i.e. chosen depending on the available figure space) unless explicitly specified.See Also
- matplotlib.axes.Axes.set_box_aspect
for a description of box aspect.
- matplotlib.axes.Axes.set_aspect
for a description of aspect handling.
- get_children()
Return a list of the child .Artists of this .Artist.
- get_clip_box()
Return the clipbox.
- get_clip_on()
Return whether the artist uses clipping.
- get_clip_path()
Return the clip path.
- get_cursor_data(event)
Return the cursor data for a given event.
Note
This method is intended to be overridden by artist subclasses. As an end-user of Matplotlib you will most likely not call this method yourself.
Cursor data can be used by Artists to provide additional context information for a given event. The default implementation just returns None.
Subclasses can override the method and return arbitrary data. However, when doing so, they must ensure that .format_cursor_data can convert the data to a string representation.
The only current use case is displaying the z-value of an .AxesImage in the status bar of a plot window, while moving the mouse.
Parameters
event : matplotlib.backend_bases.MouseEvent
See Also
format_cursor_data
- get_data_ratio()
Return the aspect ratio of the scaled data.
Notes
This method is intended to be overridden by new projection types.
- get_default_bbox_extra_artists()
Return a default list of artists that are used for the bounding box calculation.
Artists are excluded either by not being visible or
artist.set_in_layout(False).
- get_facecolor()
Get the facecolor of the Axes.
- get_fc()
Alias for get_facecolor.
- get_figure()
Return the .Figure instance the artist belongs to.
- get_frame_on()
Get whether the Axes rectangle patch is drawn.
- get_gid()
Return the group id.
- get_images()
Return a list of .AxesImages contained by the Axes.
- get_in_layout()
Return boolean flag,
Trueif artist is included in layout calculations.E.g. /tutorials/intermediate/constrainedlayout_guide, .Figure.tight_layout(), and
fig.savefig(fname, bbox_inches='tight').
- get_label()
Return the label used for this artist in the legend.
- get_legend()
Return the .Legend instance, or None if no legend is defined.
- get_legend_handles_labels(legend_handler_map=None)[source]
Return handles and labels for legend
ax.legend()is equivalent toh, l = ax.get_legend_handles_labels() ax.legend(h, l)
- get_lines()
Return a list of lines contained by the Axes.
- get_mouseover()
Return whether this artist is queried for custom context information when the mouse cursor moves over it.
Get whether the Axes responds to navigation commands.
Get the navigation toolbar button status: ‘PAN’, ‘ZOOM’, or None.
- get_picker()
Return the picking behavior of the artist.
The possible values are described in .set_picker.
See Also
set_picker, pickable, pick
- get_position(original=False)
Return the position of the Axes within the figure as a .Bbox.
Parameters
- originalbool
If
True, return the original position. Otherwise return the active position. For an explanation of the positions see .set_position.
Returns
.Bbox
- get_rasterization_zorder()
Return the zorder value below which artists will be rasterized.
- get_rasterized()
Return whether the artist is to be rasterized.
- get_renderer_cache()
[Deprecated]
Notes
Deprecated since version 3.6: Use Axes.figure.canvas.get_renderer() instead.
Return an immutable view on the shared x-axes Grouper.
Return an immutable view on the shared y-axes Grouper.
- get_sketch_params()
Return the sketch parameters for the artist.
Returns
tuple or None
A 3-tuple with the following elements:
scale: The amplitude of the wiggle perpendicular to the source line.
length: The length of the wiggle along the line.
randomness: The scale factor by which the length is shrunken or expanded.
Returns None if no sketch parameters were set.
- get_snap()
Return the snap setting.
See .set_snap for details.
- get_tightbbox(renderer=None, call_axes_locator=True, bbox_extra_artists=None, *, for_layout_only=False)
Return the tight bounding box of the Axes, including axis and their decorators (xlabel, title, etc).
Artists that have
artist.set_in_layout(False)are not included in the bbox.Parameters
- renderer.RendererBase subclass
renderer that will be used to draw the figures (i.e.
fig.canvas.get_renderer())- bbox_extra_artistslist of .Artist or
None List of artists to include in the tight bounding box. If
None(default), then all artist children of the Axes are included in the tight bounding box.- call_axes_locatorbool, default: True
If call_axes_locator is
False, it does not call the_axes_locatorattribute, which is necessary to get the correct bounding box.call_axes_locator=Falsecan be used if the caller is only interested in the relative size of the tightbbox compared to the Axes bbox.- for_layout_onlydefault: False
The bounding box will not include the x-extent of the title and the xlabel, or the y-extent of the ylabel.
Returns
- .BboxBase
Bounding box in figure pixel coordinates.
See Also
matplotlib.axes.Axes.get_window_extent matplotlib.axis.Axis.get_tightbbox matplotlib.spines.Spine.get_window_extent
- get_title(loc='center')[source]
Get an Axes title.
Get one of the three available Axes titles. The available titles are positioned above the Axes in the center, flush with the left edge, and flush with the right edge.
Parameters
- loc{‘center’, ‘left’, ‘right’}, str, default: ‘center’
Which title to return.
Returns
- str
The title text string.
- get_transform()
Return the .Transform instance used by this artist.
- get_transformed_clip_path_and_affine()
Return the clip path with the non-affine part of its transformation applied, and the remaining affine part of its transformation.
- get_url()
Return the url.
- get_visible()
Return the visibility.
- get_window_extent(renderer=None, *args, **kwargs)
Return the Axes bounding box in display space; args and kwargs are empty.
This bounding box does not include the spines, ticks, ticklabels, or other labels. For a bounding box including these elements use ~matplotlib.axes.Axes.get_tightbbox.
See Also
matplotlib.axes.Axes.get_tightbbox matplotlib.axis.Axis.get_tightbbox matplotlib.spines.Spine.get_window_extent
- get_xaxis()
[Discouraged] Return the XAxis instance.
Discouraged
The use of this function is discouraged. You should instead directly access the attribute
ax.xaxis.
- get_xaxis_text1_transform(pad_points)
Returns
- transformTransform
The transform used for drawing x-axis labels, which will add pad_points of padding (in points) between the axis and the label. The x-direction is in data coordinates and the y-direction is in axis coordinates
- valign{‘center’, ‘top’, ‘bottom’, ‘baseline’, ‘center_baseline’}
The text vertical alignment.
- halign{‘center’, ‘left’, ‘right’}
The text horizontal alignment.
Notes
This transformation is primarily used by the ~matplotlib.axis.Axis class, and is meant to be overridden by new kinds of projections that may need to place axis elements in different locations.
- get_xaxis_text2_transform(pad_points)
Returns
- transformTransform
The transform used for drawing secondary x-axis labels, which will add pad_points of padding (in points) between the axis and the label. The x-direction is in data coordinates and the y-direction is in axis coordinates
- valign{‘center’, ‘top’, ‘bottom’, ‘baseline’, ‘center_baseline’}
The text vertical alignment.
- halign{‘center’, ‘left’, ‘right’}
The text horizontal alignment.
Notes
This transformation is primarily used by the ~matplotlib.axis.Axis class, and is meant to be overridden by new kinds of projections that may need to place axis elements in different locations.
- get_xaxis_transform(which='grid')
Get the transformation used for drawing x-axis labels, ticks and gridlines. The x-direction is in data coordinates and the y-direction is in axis coordinates.
Note
This transformation is primarily used by the ~matplotlib.axis.Axis class, and is meant to be overridden by new kinds of projections that may need to place axis elements in different locations.
- get_xbound()
Return the lower and upper x-axis bounds, in increasing order.
See Also
set_xbound get_xlim, set_xlim invert_xaxis, xaxis_inverted
- get_xgridlines()
Return the xaxis’ grid lines as a list of .Line2Ds.
- get_xlabel()
Get the xlabel text string.
- get_xlim()
Return the x-axis view limits.
Returns
- left, right(float, float)
The current x-axis limits in data coordinates.
See Also
.Axes.set_xlim set_xbound, get_xbound invert_xaxis, xaxis_inverted
Notes
The x-axis may be inverted, in which case the left value will be greater than the right value.
- get_xmajorticklabels()
Return the xaxis’ major tick labels, as a list of ~.text.Text.
- get_xminorticklabels()
Return the xaxis’ minor tick labels, as a list of ~.text.Text.
- get_xscale()
Return the xaxis’ scale (as a str).
- get_xticklabels(minor=False, which=None)
Get the xaxis’ tick labels.
Parameters
- minorbool
Whether to return the minor or the major ticklabels.
- whichNone, (‘minor’, ‘major’, ‘both’)
Overrides minor.
Selects which ticklabels to return
Returns
list of ~matplotlib.text.Text
- get_xticklines(minor=False)
Return the xaxis’ tick lines as a list of .Line2Ds.
- get_xticks(*, minor=False)
Return the xaxis’ tick locations in data coordinates.
The locations are not clipped to the current axis limits and hence may contain locations that are not visible in the output.
Parameters
- minorbool, default: False
True to return the minor tick directions, False to return the major tick directions.
Returns
numpy array of tick locations
- get_yaxis()
[Discouraged] Return the YAxis instance.
Discouraged
The use of this function is discouraged. You should instead directly access the attribute
ax.yaxis.
- get_yaxis_text1_transform(pad_points)
Returns
- transformTransform
The transform used for drawing y-axis labels, which will add pad_points of padding (in points) between the axis and the label. The x-direction is in axis coordinates and the y-direction is in data coordinates
- valign{‘center’, ‘top’, ‘bottom’, ‘baseline’, ‘center_baseline’}
The text vertical alignment.
- halign{‘center’, ‘left’, ‘right’}
The text horizontal alignment.
Notes
This transformation is primarily used by the ~matplotlib.axis.Axis class, and is meant to be overridden by new kinds of projections that may need to place axis elements in different locations.
- get_yaxis_text2_transform(pad_points)
Returns
- transformTransform
The transform used for drawing secondart y-axis labels, which will add pad_points of padding (in points) between the axis and the label. The x-direction is in axis coordinates and the y-direction is in data coordinates
- valign{‘center’, ‘top’, ‘bottom’, ‘baseline’, ‘center_baseline’}
The text vertical alignment.
- halign{‘center’, ‘left’, ‘right’}
The text horizontal alignment.
Notes
This transformation is primarily used by the ~matplotlib.axis.Axis class, and is meant to be overridden by new kinds of projections that may need to place axis elements in different locations.
- get_yaxis_transform(which='grid')
Get the transformation used for drawing y-axis labels, ticks and gridlines. The x-direction is in axis coordinates and the y-direction is in data coordinates.
Note
This transformation is primarily used by the ~matplotlib.axis.Axis class, and is meant to be overridden by new kinds of projections that may need to place axis elements in different locations.
- get_ybound()
Return the lower and upper y-axis bounds, in increasing order.
See Also
set_ybound get_ylim, set_ylim invert_yaxis, yaxis_inverted
- get_ygridlines()
Return the yaxis’ grid lines as a list of .Line2Ds.
- get_ylabel()
Get the ylabel text string.
- get_ylim()
Return the y-axis view limits.
Returns
- bottom, top(float, float)
The current y-axis limits in data coordinates.
See Also
.Axes.set_ylim set_ybound, get_ybound invert_yaxis, yaxis_inverted
Notes
The y-axis may be inverted, in which case the bottom value will be greater than the top value.
- get_ymajorticklabels()
Return the yaxis’ major tick labels, as a list of ~.text.Text.
- get_yminorticklabels()
Return the yaxis’ minor tick labels, as a list of ~.text.Text.
- get_yscale()
Return the yaxis’ scale (as a str).
- get_yticklabels(minor=False, which=None)
Get the yaxis’ tick labels.
Parameters
- minorbool
Whether to return the minor or the major ticklabels.
- whichNone, (‘minor’, ‘major’, ‘both’)
Overrides minor.
Selects which ticklabels to return
Returns
list of ~matplotlib.text.Text
- get_yticklines(minor=False)
Return the yaxis’ tick lines as a list of .Line2Ds.
- get_yticks(*, minor=False)
Return the yaxis’ tick locations in data coordinates.
The locations are not clipped to the current axis limits and hence may contain locations that are not visible in the output.
Parameters
- minorbool, default: False
True to return the minor tick directions, False to return the major tick directions.
Returns
numpy array of tick locations
- get_zorder()
Return the artist’s zorder.
- grid(visible=None, which='major', axis='both', **kwargs)
Configure the grid lines.
Parameters
- visiblebool or None, optional
Whether to show the grid lines. If any kwargs are supplied, it is assumed you want the grid on and visible will be set to True.
If visible is None and there are no kwargs, this toggles the visibility of the lines.
- which{‘major’, ‘minor’, ‘both’}, optional
The grid lines to apply the changes on.
- axis{‘both’, ‘x’, ‘y’}, optional
The axis to apply the changes on.
- **kwargs.Line2D properties
Define the line properties of the grid, e.g.:
grid(color='r', linestyle='-', linewidth=2)
Valid keyword arguments are:
Properties: agg_filter: a filter function, which takes a (m, n, 3) float array and a dpi value, and returns a (m, n, 3) array and two offsets from the bottom left corner of the image alpha: scalar or None animated: bool antialiased or aa: bool clip_box: .Bbox clip_on: bool clip_path: Patch or (Path, Transform) or None color or c: color dash_capstyle: .CapStyle or {‘butt’, ‘projecting’, ‘round’} dash_joinstyle: .JoinStyle or {‘miter’, ‘round’, ‘bevel’} dashes: sequence of floats (on/off ink in points) or (None, None) data: (2, N) array or two 1D arrays drawstyle or ds: {‘default’, ‘steps’, ‘steps-pre’, ‘steps-mid’, ‘steps-post’}, default: ‘default’ figure: .Figure fillstyle: {‘full’, ‘left’, ‘right’, ‘bottom’, ‘top’, ‘none’} gapcolor: color or None gid: str in_layout: bool label: object linestyle or ls: {‘-’, ‘–’, ‘-.’, ‘:’, ‘’, (offset, on-off-seq), …} linewidth or lw: float marker: marker style string, ~.path.Path or ~.markers.MarkerStyle markeredgecolor or mec: color markeredgewidth or mew: float markerfacecolor or mfc: color markerfacecoloralt or mfcalt: color markersize or ms: float markevery: None or int or (int, int) or slice or list[int] or float or (float, float) or list[bool] mouseover: bool path_effects: .AbstractPathEffect picker: float or callable[[Artist, Event], tuple[bool, dict]] pickradius: unknown rasterized: bool sketch_params: (scale: float, length: float, randomness: float) snap: bool or None solid_capstyle: .CapStyle or {‘butt’, ‘projecting’, ‘round’} solid_joinstyle: .JoinStyle or {‘miter’, ‘round’, ‘bevel’} transform: unknown url: str visible: bool xdata: 1D array ydata: 1D array zorder: float
Notes
The axis is drawn as a unit, so the effective zorder for drawing the grid is determined by the zorder of each axis, not by the zorder of the .Line2D objects comprising the grid. Therefore, to set grid zorder, use .set_axisbelow or, for more control, call the ~.Artist.set_zorder method of each axis.
- has_data()
Return whether any artists have been added to the Axes.
This should not be used to determine whether the dataLim need to be updated, and may not actually be useful for anything.
- have_units()
Return whether units are set on any axis.
- hexbin(x, y, C=None, gridsize=100, bins=None, xscale='linear', yscale='linear', extent=None, cmap=None, norm=None, vmin=None, vmax=None, alpha=None, linewidths=None, edgecolors='face', reduce_C_function=<function mean>, mincnt=None, marginals=False, *, data=None, **kwargs)[source]
Make a 2D hexagonal binning plot of points x, y.
If C is None, the value of the hexagon is determined by the number of points in the hexagon. Otherwise, C specifies values at the coordinate (x[i], y[i]). For each hexagon, these values are reduced using reduce_C_function.
Parameters
- x, yarray-like
The data positions. x and y must be of the same length.
- Carray-like, optional
If given, these values are accumulated in the bins. Otherwise, every point has a value of 1. Must be of the same length as x and y.
- gridsizeint or (int, int), default: 100
If a single int, the number of hexagons in the x-direction. The number of hexagons in the y-direction is chosen such that the hexagons are approximately regular.
Alternatively, if a tuple (nx, ny), the number of hexagons in the x-direction and the y-direction. In the y-direction, counting is done along vertically aligned hexagons, not along the zig-zag chains of hexagons; see the following illustration.
(Source code, png, hires.png, pdf)

To get approximately regular hexagons, choose \(n_x = \sqrt{3}\,n_y\).
- bins‘log’ or int or sequence, default: None
Discretization of the hexagon values.
If None, no binning is applied; the color of each hexagon directly corresponds to its count value.
If ‘log’, use a logarithmic scale for the colormap. Internally, \(log_{10}(i+1)\) is used to determine the hexagon color. This is equivalent to
norm=LogNorm().If an integer, divide the counts in the specified number of bins, and color the hexagons accordingly.
If a sequence of values, the values of the lower bound of the bins to be used.
- xscale{‘linear’, ‘log’}, default: ‘linear’
Use a linear or log10 scale on the horizontal axis.
- yscale{‘linear’, ‘log’}, default: ‘linear’
Use a linear or log10 scale on the vertical axis.
- mincntint > 0, default: None
If not None, only display cells with more than mincnt number of points in the cell.
- marginalsbool, default: False
If marginals is True, plot the marginal density as colormapped rectangles along the bottom of the x-axis and left of the y-axis.
- extent4-tuple of float, default: None
The limits of the bins (xmin, xmax, ymin, ymax). The default assigns the limits based on gridsize, x, y, xscale and yscale.
If xscale or yscale is set to ‘log’, the limits are expected to be the exponent for a power of 10. E.g. for x-limits of 1 and 50 in ‘linear’ scale and y-limits of 10 and 1000 in ‘log’ scale, enter (1, 50, 1, 3).
Returns
- ~matplotlib.collections.PolyCollection
A .PolyCollection defining the hexagonal bins.
.PolyCollection.get_offsets contains a Mx2 array containing the x, y positions of the M hexagon centers.
.PolyCollection.get_array contains the values of the M hexagons.
If marginals is True, horizontal bar and vertical bar (both PolyCollections) will be attached to the return collection as attributes hbar and vbar.
Other Parameters
- cmapstr or ~matplotlib.colors.Colormap, default: :rc:`image.cmap`
The Colormap instance or registered colormap name used to map scalar data to colors.
- normstr or ~matplotlib.colors.Normalize, optional
The normalization method used to scale scalar data to the [0, 1] range before mapping to colors using cmap. By default, a linear scaling is used, mapping the lowest value to 0 and the highest to 1.
If given, this can be one of the following:
An instance of .Normalize or one of its subclasses (see /tutorials/colors/colormapnorms).
A scale name, i.e. one of “linear”, “log”, “symlog”, “logit”, etc. For a list of available scales, call matplotlib.scale.get_scale_names(). In that case, a suitable .Normalize subclass is dynamically generated and instantiated.
- vmin, vmaxfloat, optional
When using scalar data and no explicit norm, vmin and vmax define the data range that the colormap covers. By default, the colormap covers the complete value range of the supplied data. It is an error to use vmin/vmax when a norm instance is given (but using a str norm name together with vmin/vmax is acceptable).
- alphafloat between 0 and 1, optional
The alpha blending value, between 0 (transparent) and 1 (opaque).
- linewidthsfloat, default: None
If None, defaults to 1.0.
- edgecolors{‘face’, ‘none’, None} or color, default: ‘face’
The color of the hexagon edges. Possible values are:
‘face’: Draw the edges in the same color as the fill color.
‘none’: No edges are drawn. This can sometimes lead to unsightly unpainted pixels between the hexagons.
None: Draw outlines in the default color.
An explicit color.
- reduce_C_functioncallable, default: numpy.mean
The function to aggregate C within the bins. It is ignored if C is not given. This must have the signature:
def reduce_C_function(C: array) -> float
Commonly used functions are:
numpy.mean: average of the points
numpy.sum: integral of the point values
numpy.amax: value taken from the largest point
- dataindexable object, optional
If given, the following parameters also accept a string
s, which is interpreted asdata[s](unless this raises an exception):x, y, C
- **kwargs~matplotlib.collections.PolyCollection properties
All other keyword arguments are passed on to .PolyCollection:
Properties: agg_filter: a filter function, which takes a (m, n, 3) float array and a dpi value, and returns a (m, n, 3) array and two offsets from the bottom left corner of the image alpha: array-like or scalar or None animated: bool antialiased or aa or antialiaseds: bool or list of bools array: array-like or None capstyle: .CapStyle or {‘butt’, ‘projecting’, ‘round’} clim: (vmin: float, vmax: float) clip_box: .Bbox clip_on: bool clip_path: Patch or (Path, Transform) or None cmap: .Colormap or str or None color: color or list of rgba tuples edgecolor or ec or edgecolors: color or list of colors or ‘face’ facecolor or facecolors or fc: color or list of colors figure: .Figure gid: str hatch: {‘/’, ‘\’, ‘|’, ‘-’, ‘+’, ‘x’, ‘o’, ‘O’, ‘.’, ‘*’} in_layout: bool joinstyle: .JoinStyle or {‘miter’, ‘round’, ‘bevel’} label: object linestyle or dashes or linestyles or ls: str or tuple or list thereof linewidth or linewidths or lw: float or list of floats mouseover: bool norm: .Normalize or str or None offset_transform or transOffset: unknown offsets: (N, 2) or (2,) array-like path_effects: .AbstractPathEffect paths: list of array-like picker: None or bool or float or callable pickradius: unknown rasterized: bool sizes: ndarray or None sketch_params: (scale: float, length: float, randomness: float) snap: bool or None transform: .Transform url: str urls: list of str or None verts: list of array-like verts_and_codes: unknown visible: bool zorder: float
See Also
hist2d : 2D histogram rectangular bins
- hist(x, bins=None, range=None, density=False, weights=None, cumulative=False, bottom=None, histtype='bar', align='mid', orientation='vertical', rwidth=None, log=False, color=None, label=None, stacked=False, *, data=None, **kwargs)[source]
Compute and plot a histogram.
This method uses numpy.histogram to bin the data in x and count the number of values in each bin, then draws the distribution either as a .BarContainer or .Polygon. The bins, range, density, and weights parameters are forwarded to numpy.histogram.
If the data has already been binned and counted, use ~.bar or ~.stairs to plot the distribution:
counts, bins = np.histogram(x)
plt.stairs(counts, bins)
Alternatively, plot pre-computed bins and counts using
hist()by treating each bin as a single point with a weight equal to its count:plt.hist(bins[:-1], bins, weights=counts)
The data input x can be a singular array, a list of datasets of potentially different lengths ([x0, x1, …]), or a 2D ndarray in which each column is a dataset. Note that the ndarray form is transposed relative to the list form. If the input is an array, then the return value is a tuple (n, bins, patches); if the input is a sequence of arrays, then the return value is a tuple ([n0, n1, …], bins, [patches0, patches1, …]).
Masked arrays are not supported.
Parameters
- x(n,) array or sequence of (n,) arrays
Input values, this takes either a single array or a sequence of arrays which are not required to be of the same length.
- binsint or sequence or str, default: :rc:`hist.bins`
If bins is an integer, it defines the number of equal-width bins in the range.
If bins is a sequence, it defines the bin edges, including the left edge of the first bin and the right edge of the last bin; in this case, bins may be unequally spaced. All but the last (righthand-most) bin is half-open. In other words, if bins is:
[1, 2, 3, 4]
then the first bin is
[1, 2)(including 1, but excluding 2) and the second[2, 3). The last bin, however, is[3, 4], which includes 4.If bins is a string, it is one of the binning strategies supported by numpy.histogram_bin_edges: ‘auto’, ‘fd’, ‘doane’, ‘scott’, ‘stone’, ‘rice’, ‘sturges’, or ‘sqrt’.
- rangetuple or None, default: None
The lower and upper range of the bins. Lower and upper outliers are ignored. If not provided, range is
(x.min(), x.max()). Range has no effect if bins is a sequence.If bins is a sequence or range is specified, autoscaling is based on the specified bin range instead of the range of x.
- densitybool, default: False
If
True, draw and return a probability density: each bin will display the bin’s raw count divided by the total number of counts and the bin width (density = counts / (sum(counts) * np.diff(bins))), so that the area under the histogram integrates to 1 (np.sum(density * np.diff(bins)) == 1).If stacked is also
True, the sum of the histograms is normalized to 1.- weights(n,) array-like or None, default: None
An array of weights, of the same shape as x. Each value in x only contributes its associated weight towards the bin count (instead of 1). If density is
True, the weights are normalized, so that the integral of the density over the range remains 1.- cumulativebool or -1, default: False
If
True, then a histogram is computed where each bin gives the counts in that bin plus all bins for smaller values. The last bin gives the total number of datapoints.If density is also
Truethen the histogram is normalized such that the last bin equals 1.If cumulative is a number less than 0 (e.g., -1), the direction of accumulation is reversed. In this case, if density is also
True, then the histogram is normalized such that the first bin equals 1.- bottomarray-like, scalar, or None, default: None
Location of the bottom of each bin, ie. bins are drawn from
bottomtobottom + hist(x, bins)If a scalar, the bottom of each bin is shifted by the same amount. If an array, each bin is shifted independently and the length of bottom must match the number of bins. If None, defaults to 0.- histtype{‘bar’, ‘barstacked’, ‘step’, ‘stepfilled’}, default: ‘bar’
The type of histogram to draw.
‘bar’ is a traditional bar-type histogram. If multiple data are given the bars are arranged side by side.
‘barstacked’ is a bar-type histogram where multiple data are stacked on top of each other.
‘step’ generates a lineplot that is by default unfilled.
‘stepfilled’ generates a lineplot that is by default filled.
- align{‘left’, ‘mid’, ‘right’}, default: ‘mid’
The horizontal alignment of the histogram bars.
‘left’: bars are centered on the left bin edges.
‘mid’: bars are centered between the bin edges.
‘right’: bars are centered on the right bin edges.
- orientation{‘vertical’, ‘horizontal’}, default: ‘vertical’
If ‘horizontal’, ~.Axes.barh will be used for bar-type histograms and the bottom kwarg will be the left edges.
- rwidthfloat or None, default: None
The relative width of the bars as a fraction of the bin width. If
None, automatically compute the width.Ignored if histtype is ‘step’ or ‘stepfilled’.
- logbool, default: False
If
True, the histogram axis will be set to a log scale.- colorcolor or array-like of colors or None, default: None
Color or sequence of colors, one per dataset. Default (
None) uses the standard line color sequence.- labelstr or None, default: None
String, or sequence of strings to match multiple datasets. Bar charts yield multiple patches per dataset, but only the first gets the label, so that ~.Axes.legend will work as expected.
- stackedbool, default: False
If
True, multiple data are stacked on top of each other IfFalsemultiple data are arranged side by side if histtype is ‘bar’ or on top of each other if histtype is ‘step’
Returns
- narray or list of arrays
The values of the histogram bins. See density and weights for a description of the possible semantics. If input x is an array, then this is an array of length nbins. If input is a sequence of arrays
[data1, data2, ...], then this is a list of arrays with the values of the histograms for each of the arrays in the same order. The dtype of the array n (or of its element arrays) will always be float even if no weighting or normalization is used.- binsarray
The edges of the bins. Length nbins + 1 (nbins left edges and right edge of last bin). Always a single array even when multiple data sets are passed in.
- patches.BarContainer or list of a single .Polygon or list of such objects
Container of individual artists used to create the histogram or list of such containers if there are multiple input datasets.
Other Parameters
- dataindexable object, optional
If given, the following parameters also accept a string
s, which is interpreted asdata[s](unless this raises an exception):x, weights
- **kwargs
~matplotlib.patches.Patch properties
See Also
hist2d : 2D histogram with rectangular bins hexbin : 2D histogram with hexagonal bins
Notes
For large numbers of bins (>1000), plotting can be significantly faster if histtype is set to ‘step’ or ‘stepfilled’ rather than ‘bar’ or ‘barstacked’.
- hist2d(x, y, bins=10, range=None, density=False, weights=None, cmin=None, cmax=None, *, data=None, **kwargs)[source]
Make a 2D histogram plot.
Parameters
- x, yarray-like, shape (n, )
Input values
bins : None or int or [int, int] or array-like or [array, array]
The bin specification:
If int, the number of bins for the two dimensions (nx=ny=bins).
If
[int, int], the number of bins in each dimension (nx, ny = bins).If array-like, the bin edges for the two dimensions (x_edges=y_edges=bins).
If
[array, array], the bin edges in each dimension (x_edges, y_edges = bins).
The default value is 10.
- rangearray-like shape(2, 2), optional
The leftmost and rightmost edges of the bins along each dimension (if not specified explicitly in the bins parameters):
[[xmin,
xmax], [ymin, ymax]]
. All values outside of this range will be considered outliers and not tallied in the histogram.- densitybool, default: False
Normalize histogram. See the documentation for the density parameter of ~.Axes.hist for more details.
- weightsarray-like, shape (n, ), optional
An array of values w_i weighing each sample (x_i, y_i).
- cmin, cmaxfloat, default: None
All bins that has count less than cmin or more than cmax will not be displayed (set to NaN before passing to imshow) and these count values in the return value count histogram will also be set to nan upon return.
Returns
- h2D array
The bi-dimensional histogram of samples x and y. Values in x are histogrammed along the first dimension and values in y are histogrammed along the second dimension.
- xedges1D array
The bin edges along the x axis.
- yedges1D array
The bin edges along the y axis.
image : ~.matplotlib.collections.QuadMesh
Other Parameters
- cmapstr or ~matplotlib.colors.Colormap, default: :rc:`image.cmap`
The Colormap instance or registered colormap name used to map scalar data to colors.
- normstr or ~matplotlib.colors.Normalize, optional
The normalization method used to scale scalar data to the [0, 1] range before mapping to colors using cmap. By default, a linear scaling is used, mapping the lowest value to 0 and the highest to 1.
If given, this can be one of the following:
An instance of .Normalize or one of its subclasses (see /tutorials/colors/colormapnorms).
A scale name, i.e. one of “linear”, “log”, “symlog”, “logit”, etc. For a list of available scales, call matplotlib.scale.get_scale_names(). In that case, a suitable .Normalize subclass is dynamically generated and instantiated.
- vmin, vmaxfloat, optional
When using scalar data and no explicit norm, vmin and vmax define the data range that the colormap covers. By default, the colormap covers the complete value range of the supplied data. It is an error to use vmin/vmax when a norm instance is given (but using a str norm name together with vmin/vmax is acceptable).
- alpha
0 <= scalar <= 1orNone, optional The alpha blending value.
- dataindexable object, optional
If given, the following parameters also accept a string
s, which is interpreted asdata[s](unless this raises an exception):x, y, weights
- **kwargs
Additional parameters are passed along to the ~.Axes.pcolormesh method and ~matplotlib.collections.QuadMesh constructor.
See Also
hist : 1D histogram plotting hexbin : 2D histogram with hexagonal bins
Notes
Currently
hist2dcalculates its own axis limits, and any limits previously set are ignored.Rendering the histogram with a logarithmic color scale is accomplished by passing a .colors.LogNorm instance to the norm keyword argument. Likewise, power-law normalization (similar in effect to gamma correction) can be accomplished with .colors.PowerNorm.
- hlines(y, xmin, xmax, colors=None, linestyles='solid', label='', *, data=None, **kwargs)[source]
Plot horizontal lines at each y from xmin to xmax.
Parameters
- yfloat or array-like
y-indexes where to plot the lines.
- xmin, xmaxfloat or array-like
Respective beginning and end of each line. If scalars are provided, all lines will have the same length.
colors : list of colors, default: :rc:`lines.color`
linestyles : {‘solid’, ‘dashed’, ‘dashdot’, ‘dotted’}, optional
label : str, default: ‘’
Returns
~matplotlib.collections.LineCollection
Other Parameters
- dataindexable object, optional
If given, the following parameters also accept a string
s, which is interpreted asdata[s](unless this raises an exception):y, xmin, xmax, colors
**kwargs : ~matplotlib.collections.LineCollection properties.
See Also
vlines : vertical lines axhline : horizontal line across the Axes
- imshow(X, cmap=None, norm=None, *, aspect=None, interpolation=None, alpha=None, vmin=None, vmax=None, origin=None, extent=None, interpolation_stage=None, filternorm=True, filterrad=4.0, resample=None, url=None, data=None, **kwargs)[source]
Display data as an image, i.e., on a 2D regular raster.
The input may either be actual RGB(A) data, or 2D scalar data, which will be rendered as a pseudocolor image. For displaying a grayscale image set up the colormapping using the parameters
cmap='gray', vmin=0, vmax=255.The number of pixels used to render an image is set by the Axes size and the dpi of the figure. This can lead to aliasing artifacts when the image is resampled because the displayed image size will usually not match the size of X (see /gallery/images_contours_and_fields/image_antialiasing). The resampling can be controlled via the interpolation parameter and/or :rc:`image.interpolation`.
Parameters
- Xarray-like or PIL image
The image data. Supported array shapes are:
(M, N): an image with scalar data. The values are mapped to colors using normalization and a colormap. See parameters norm, cmap, vmin, vmax.
(M, N, 3): an image with RGB values (0-1 float or 0-255 int).
(M, N, 4): an image with RGBA values (0-1 float or 0-255 int), i.e. including transparency.
The first two dimensions (M, N) define the rows and columns of the image.
Out-of-range RGB(A) values are clipped.
- cmapstr or ~matplotlib.colors.Colormap, default: :rc:`image.cmap`
The Colormap instance or registered colormap name used to map scalar data to colors.
This parameter is ignored if X is RGB(A).
- normstr or ~matplotlib.colors.Normalize, optional
The normalization method used to scale scalar data to the [0, 1] range before mapping to colors using cmap. By default, a linear scaling is used, mapping the lowest value to 0 and the highest to 1.
If given, this can be one of the following:
An instance of .Normalize or one of its subclasses (see /tutorials/colors/colormapnorms).
A scale name, i.e. one of “linear”, “log”, “symlog”, “logit”, etc. For a list of available scales, call matplotlib.scale.get_scale_names(). In that case, a suitable .Normalize subclass is dynamically generated and instantiated.
This parameter is ignored if X is RGB(A).
- vmin, vmaxfloat, optional
When using scalar data and no explicit norm, vmin and vmax define the data range that the colormap covers. By default, the colormap covers the complete value range of the supplied data. It is an error to use vmin/vmax when a norm instance is given (but using a str norm name together with vmin/vmax is acceptable).
This parameter is ignored if X is RGB(A).
- aspect{‘equal’, ‘auto’} or float, default: :rc:`image.aspect`
The aspect ratio of the Axes. This parameter is particularly relevant for images since it determines whether data pixels are square.
This parameter is a shortcut for explicitly calling .Axes.set_aspect. See there for further details.
‘equal’: Ensures an aspect ratio of 1. Pixels will be square (unless pixel sizes are explicitly made non-square in data coordinates using extent).
‘auto’: The Axes is kept fixed and the aspect is adjusted so that the data fit in the Axes. In general, this will result in non-square pixels.
- interpolationstr, default: :rc:`image.interpolation`
The interpolation method used.
Supported values are ‘none’, ‘antialiased’, ‘nearest’, ‘bilinear’, ‘bicubic’, ‘spline16’, ‘spline36’, ‘hanning’, ‘hamming’, ‘hermite’, ‘kaiser’, ‘quadric’, ‘catrom’, ‘gaussian’, ‘bessel’, ‘mitchell’, ‘sinc’, ‘lanczos’, ‘blackman’.
If interpolation is ‘none’, then no interpolation is performed on the Agg, ps, pdf and svg backends. Other backends will fall back to ‘nearest’. Note that most SVG renderers perform interpolation at rendering and that the default interpolation method they implement may differ.
If interpolation is the default ‘antialiased’, then ‘nearest’ interpolation is used if the image is upsampled by more than a factor of three (i.e. the number of display pixels is at least three times the size of the data array). If the upsampling rate is smaller than 3, or the image is downsampled, then ‘hanning’ interpolation is used to act as an anti-aliasing filter, unless the image happens to be upsampled by exactly a factor of two or one.
See /gallery/images_contours_and_fields/interpolation_methods for an overview of the supported interpolation methods, and /gallery/images_contours_and_fields/image_antialiasing for a discussion of image antialiasing.
Some interpolation methods require an additional radius parameter, which can be set by filterrad. Additionally, the antigrain image resize filter is controlled by the parameter filternorm.
- interpolation_stage{‘data’, ‘rgba’}, default: ‘data’
If ‘data’, interpolation is carried out on the data provided by the user. If ‘rgba’, the interpolation is carried out after the colormapping has been applied (visual interpolation).
- alphafloat or array-like, optional
The alpha blending value, between 0 (transparent) and 1 (opaque). If alpha is an array, the alpha blending values are applied pixel by pixel, and alpha must have the same shape as X.
- origin{‘upper’, ‘lower’}, default: :rc:`image.origin`
Place the [0, 0] index of the array in the upper left or lower left corner of the Axes. The convention (the default) ‘upper’ is typically used for matrices and images.
Note that the vertical axis points upward for ‘lower’ but downward for ‘upper’.
See the /tutorials/intermediate/imshow_extent tutorial for examples and a more detailed description.
- extentfloats (left, right, bottom, top), optional
The bounding box in data coordinates that the image will fill. The image is stretched individually along x and y to fill the box.
The default extent is determined by the following conditions. Pixels have unit size in data coordinates. Their centers are on integer coordinates, and their center coordinates range from 0 to columns-1 horizontally and from 0 to rows-1 vertically.
Note that the direction of the vertical axis and thus the default values for top and bottom depend on origin:
For
origin == 'upper'the default is(-0.5, numcols-0.5, numrows-0.5, -0.5).For
origin == 'lower'the default is(-0.5, numcols-0.5, -0.5, numrows-0.5).
See the /tutorials/intermediate/imshow_extent tutorial for examples and a more detailed description.
- filternormbool, default: True
A parameter for the antigrain image resize filter (see the antigrain documentation). If filternorm is set, the filter normalizes integer values and corrects the rounding errors. It doesn’t do anything with the source floating point values, it corrects only integers according to the rule of 1.0 which means that any sum of pixel weights must be equal to 1.0. So, the filter function must produce a graph of the proper shape.
- filterradfloat > 0, default: 4.0
The filter radius for filters that have a radius parameter, i.e. when interpolation is one of: ‘sinc’, ‘lanczos’ or ‘blackman’.
- resamplebool, default: :rc:`image.resample`
When True, use a full resampling method. When False, only resample when the output image is larger than the input image.
- urlstr, optional
Set the url of the created .AxesImage. See .Artist.set_url.
Returns
~matplotlib.image.AxesImage
Other Parameters
- dataindexable object, optional
If given, all parameters also accept a string
s, which is interpreted asdata[s](unless this raises an exception).- **kwargs~matplotlib.artist.Artist properties
These parameters are passed on to the constructor of the .AxesImage artist.
See Also
matshow : Plot a matrix or an array as an image.
Notes
Unless extent is used, pixel centers will be located at integer coordinates. In other words: the origin will coincide with the center of pixel (0, 0).
There are two common representations for RGB images with an alpha channel:
Straight (unassociated) alpha: R, G, and B channels represent the color of the pixel, disregarding its opacity.
Premultiplied (associated) alpha: R, G, and B channels represent the color of the pixel, adjusted for its opacity by multiplication.
~matplotlib.pyplot.imshow expects RGB images adopting the straight (unassociated) alpha representation.
- in_axes(mouseevent)
Return whether the given event (in display coords) is in the Axes.
- indicate_inset(bounds, inset_ax=None, *, transform=None, facecolor='none', edgecolor='0.5', alpha=0.5, zorder=4.99, **kwargs)[source]
Add an inset indicator to the Axes. This is a rectangle on the plot at the position indicated by bounds that optionally has lines that connect the rectangle to an inset Axes (.Axes.inset_axes).
Warnings
This method is experimental as of 3.0, and the API may change.
Parameters
- bounds[x0, y0, width, height]
Lower-left corner of rectangle to be marked, and its width and height.
- inset_ax.Axes
An optional inset Axes to draw connecting lines to. Two lines are drawn connecting the indicator box to the inset Axes on corners chosen so as to not overlap with the indicator box.
- transform.Transform
Transform for the rectangle coordinates. Defaults to ax.transAxes, i.e. the units of rect are in Axes-relative coordinates.
- facecolorcolor, default: ‘none’
Facecolor of the rectangle.
- edgecolorcolor, default: ‘0.5’
Color of the rectangle and color of the connecting lines.
- alphafloat, default: 0.5
Transparency of the rectangle and connector lines.
- zorderfloat, default: 4.99
Drawing order of the rectangle and connector lines. The default, 4.99, is just below the default level of inset Axes.
- **kwargs
Other keyword arguments are passed on to the .Rectangle patch:
Properties: agg_filter: a filter function, which takes a (m, n, 3) float array and a dpi value, and returns a (m, n, 3) array and two offsets from the bottom left corner of the image alpha: scalar or None angle: unknown animated: bool antialiased or aa: bool or None bounds: (left, bottom, width, height) capstyle: .CapStyle or {‘butt’, ‘projecting’, ‘round’} clip_box: .Bbox clip_on: bool clip_path: Patch or (Path, Transform) or None color: color edgecolor or ec: color or None facecolor or fc: color or None figure: .Figure fill: bool gid: str hatch: {‘/’, ‘\’, ‘|’, ‘-’, ‘+’, ‘x’, ‘o’, ‘O’, ‘.’, ‘*’} height: unknown in_layout: bool joinstyle: .JoinStyle or {‘miter’, ‘round’, ‘bevel’} label: object linestyle or ls: {‘-’, ‘–’, ‘-.’, ‘:’, ‘’, (offset, on-off-seq), …} linewidth or lw: float or None mouseover: bool path_effects: .AbstractPathEffect picker: None or bool or float or callable rasterized: bool sketch_params: (scale: float, length: float, randomness: float) snap: bool or None transform: .Transform url: str visible: bool width: unknown x: unknown xy: (float, float) y: unknown zorder: float
Returns
- rectangle_patch.patches.Rectangle
The indicator frame.
- connector_lines4-tuple of .patches.ConnectionPatch
The four connector lines connecting to (lower_left, upper_left, lower_right upper_right) corners of inset_ax. Two lines are set with visibility to False, but the user can set the visibility to True if the automatic choice is not deemed correct.
- indicate_inset_zoom(inset_ax, **kwargs)[source]
Add an inset indicator rectangle to the Axes based on the axis limits for an inset_ax and draw connectors between inset_ax and the rectangle.
Warnings
This method is experimental as of 3.0, and the API may change.
Parameters
- inset_ax.Axes
Inset Axes to draw connecting lines to. Two lines are drawn connecting the indicator box to the inset Axes on corners chosen so as to not overlap with the indicator box.
- **kwargs
Other keyword arguments are passed on to .Axes.indicate_inset
Returns
- rectangle_patch.patches.Rectangle
Rectangle artist.
- connector_lines4-tuple of .patches.ConnectionPatch
Each of four connector lines coming from the rectangle drawn on this axis, in the order lower left, upper left, lower right, upper right. Two are set with visibility to False, but the user can set the visibility to True if the automatic choice is not deemed correct.
- inset_axes(bounds, *, transform=None, zorder=5, **kwargs)[source]
Add a child inset Axes to this existing Axes.
Warnings
This method is experimental as of 3.0, and the API may change.
Parameters
- bounds[x0, y0, width, height]
Lower-left corner of inset Axes, and its width and height.
- transform.Transform
Defaults to ax.transAxes, i.e. the units of rect are in Axes-relative coordinates.
- projection{None, ‘aitoff’, ‘hammer’, ‘lambert’, ‘mollweide’, ‘polar’, ‘rectilinear’, str}, optional
The projection type of the inset ~.axes.Axes. str is the name of a custom projection, see ~matplotlib.projections. The default None results in a ‘rectilinear’ projection.
- polarbool, default: False
If True, equivalent to projection=’polar’.
- axes_classsubclass type of ~.axes.Axes, optional
The .axes.Axes subclass that is instantiated. This parameter is incompatible with projection and polar. See axisartist_users-guide-index for examples.
- zordernumber
Defaults to 5 (same as .Axes.legend). Adjust higher or lower to change whether it is above or below data plotted on the parent Axes.
- **kwargs
Other keyword arguments are passed on to the inset Axes class.
Returns
- ax
The created ~.axes.Axes instance.
Examples
This example makes two inset Axes, the first is in Axes-relative coordinates, and the second in data-coordinates:
fig, ax = plt.subplots()
ax.plot(range(10))
axin1 = ax.inset_axes([0.8, 0.1, 0.15, 0.15])
axin2 = ax.inset_axes(
        [5, 7, 2.3, 2.3], transform=ax.transData)
- invert_xaxis()
Invert the x-axis.
See Also
xaxis_inverted get_xlim, set_xlim get_xbound, set_xbound
- invert_yaxis()
Invert the y-axis.
See Also
yaxis_inverted get_ylim, set_ylim get_ybound, set_ybound
- is_transform_set()
Return whether the Artist has an explicitly set transform.
This is True after .set_transform has been called.
- legend(*args, **kwargs)[source]
Place a legend on the Axes.
Call signatures:
legend()
legend(handles, labels)
legend(handles=handles)
legend(labels)
The call signatures correspond to the following different ways to use this method:
1. Automatic detection of elements to be shown in the legend
The elements to be added to the legend are automatically determined, when you do not pass in any extra arguments.
In this case, the labels are taken from the artist. You can specify them either at artist creation or by calling the
set_label()method on the artist:ax.plot([1, 2, 3], label='Inline label') ax.legend()
or:
line, = ax.plot([1, 2, 3])
line.set_label('Label via method')
ax.legend()
Note
Specific artists can be excluded from the automatic legend element selection by using a label starting with an underscore, “_”. A string starting with an underscore is the default label for all artists, so calling .Axes.legend without any arguments and without setting the labels manually will result in no legend being drawn.
2. Explicitly listing the artists and labels in the legend
For full control of which artists have a legend entry, it is possible to pass an iterable of legend artists followed by an iterable of legend labels respectively:
ax.legend([line1, line2, line3], ['label1', 'label2', 'label3'])
3. Explicitly listing the artists in the legend
This is similar to 2, but the labels are taken from the artists’ label properties. Example:
line1, = ax.plot([1, 2, 3], label='label1')
line2, = ax.plot([1, 2, 3], label='label2')
ax.legend(handles=[line1, line2])
4. Labeling existing plot elements
Discouraged
This call signature is discouraged, because the relation between plot elements and labels is only implicit by their order and can easily be mixed up.
To make a legend for all artists on an Axes, call this function with an iterable of strings, one for each legend item. For example:
ax.plot([1, 2, 3])
ax.plot([5, 6, 7])
ax.legend(['First line', 'Second line'])
Parameters
- handlessequence of .Artist, optional
A list of Artists (lines, patches) to be added to the legend. Use this together with labels, if you need full control on what is shown in the legend and the automatic mechanism described above is not sufficient.
The length of handles and labels should be the same in this case. If they are not, they are truncated to the smaller length.
- labelslist of str, optional
A list of labels to show next to the artists. Use this together with handles, if you need full control on what is shown in the legend and the automatic mechanism described above is not sufficient.
Returns
~matplotlib.legend.Legend
Other Parameters
- locstr or pair of floats, default: :rc:`legend.loc` (‘best’ for axes, ‘upper right’ for figures)
The location of the legend.
The strings
'upper left', 'upper right', 'lower left', 'lower right'place the legend at the corresponding corner of the axes/figure.The strings
'upper center', 'lower center', 'center left', 'center right'place the legend at the center of the corresponding edge of the axes/figure.The string
'center'places the legend at the center of the axes/figure.The string
'best'places the legend at the location, among the nine locations defined so far, with the minimum overlap with other drawn artists. This option can be quite slow for plots with large amounts of data; your plotting speed may benefit from providing a specific location.The location can also be a 2-tuple giving the coordinates of the lower-left corner of the legend in axes coordinates (in which case bbox_to_anchor will be ignored).
For back-compatibility,
'center right'(but no other location) can also be spelled'right', and each “string” locations can also be given as a numeric value:Location String
Location Code
‘best’
0
‘upper right’
1
‘upper left’
2
‘lower left’
3
‘lower right’
4
‘right’
5
‘center left’
6
‘center right’
7
‘lower center’
8
‘upper center’
9
‘center’
10
- bbox_to_anchor.BboxBase, 2-tuple, or 4-tuple of floats
Box that is used to position the legend in conjunction with loc. Defaults to axes.bbox (if called as a method to .Axes.legend) or figure.bbox (if .Figure.legend). This argument allows arbitrary placement of the legend.
Bbox coordinates are interpreted in the coordinate system given by bbox_transform, with the default transform Axes or Figure coordinates, depending on which
legendis called.If a 4-tuple or .BboxBase is given, then it specifies the bbox
(x, y, width, height)that the legend is placed in. To put the legend in the best location in the bottom right quadrant of the axes (or figure):loc='best', bbox_to_anchor=(0.5, 0., 0.5, 0.5)
A 2-tuple
(x, y)places the corner of the legend specified by loc at x, y. For example, to put the legend’s upper right-hand corner in the center of the axes (or figure) the following keywords can be used:loc='upper right', bbox_to_anchor=(0.5, 0.5)
- ncolsint, default: 1
The number of columns that the legend has.
For backward compatibility, the spelling ncol is also supported but it is discouraged. If both are given, ncols takes precedence.
- propNone or matplotlib.font_manager.FontProperties or dict
The font properties of the legend. If None (default), the current
matplotlib.rcParamswill be used.- fontsizeint or {‘xx-small’, ‘x-small’, ‘small’, ‘medium’, ‘large’, ‘x-large’, ‘xx-large’}
The font size of the legend. If the value is numeric the size will be the absolute font size in points. String values are relative to the current default font size. This argument is only used if prop is not specified.
- labelcolorstr or list, default: :rc:`legend.labelcolor`
The color of the text in the legend. Either a valid color string (for example, ‘red’), or a list of color strings. The labelcolor can also be made to match the color of the line or marker using ‘linecolor’, ‘markerfacecolor’ (or ‘mfc’), or ‘markeredgecolor’ (or ‘mec’).
Labelcolor can be set globally using :rc:`legend.labelcolor`. If None, use :rc:`text.color`.
- numpointsint, default: :rc:`legend.numpoints`
The number of marker points in the legend when creating a legend entry for a .Line2D (line).
- scatterpointsint, default: :rc:`legend.scatterpoints`
The number of marker points in the legend when creating a legend entry for a .PathCollection (scatter plot).
- scatteryoffsetsiterable of floats, default:
[0.375, 0.5, 0.3125] The vertical offset (relative to the font size) for the markers created for a scatter plot legend entry. 0.0 is at the base the legend text, and 1.0 is at the top. To draw all markers at the same height, set to
[0.5].- markerscalefloat, default: :rc:`legend.markerscale`
The relative size of legend markers compared with the originally drawn ones.
- markerfirstbool, default: True
If True, legend marker is placed to the left of the legend label. If False, legend marker is placed to the right of the legend label.
- frameonbool, default: :rc:`legend.frameon`
Whether the legend should be drawn on a patch (frame).
- fancyboxbool, default: :rc:`legend.fancybox`
Whether round edges should be enabled around the .FancyBboxPatch which makes up the legend’s background.
- shadowbool, default: :rc:`legend.shadow`
Whether to draw a shadow behind the legend.
- framealphafloat, default: :rc:`legend.framealpha`
The alpha transparency of the legend’s background. If shadow is activated and framealpha is
None, the default value is ignored.- facecolor“inherit” or color, default: :rc:`legend.facecolor`
The legend’s background color. If
"inherit", use :rc:`axes.facecolor`.- edgecolor“inherit” or color, default: :rc:`legend.edgecolor`
The legend’s background patch edge color. If
"inherit", use take :rc:`axes.edgecolor`.- mode{“expand”, None}
If mode is set to
"expand"the legend will be horizontally expanded to fill the axes area (or bbox_to_anchor if defines the legend’s size).- bbox_transformNone or matplotlib.transforms.Transform
The transform for the bounding box (bbox_to_anchor). For a value of
None(default) the Axes’transAxestransform will be used.- titlestr or None
The legend’s title. Default is no title (
None).- title_fontpropertiesNone or matplotlib.font_manager.FontProperties or dict
The font properties of the legend’s title. If None (default), the title_fontsize argument will be used if present; if title_fontsize is also None, the current :rc:`legend.title_fontsize` will be used.
- title_fontsizeint or {‘xx-small’, ‘x-small’, ‘small’, ‘medium’, ‘large’, ‘x-large’, ‘xx-large’}, default: :rc:`legend.title_fontsize`
The font size of the legend’s title. Note: This cannot be combined with title_fontproperties. If you want to set the fontsize alongside other font properties, use the size parameter in title_fontproperties.
- alignment{‘center’, ‘left’, ‘right’}, default: ‘center’
The alignment of the legend title and the box of entries. The entries are aligned as a single block, so that markers always lined up.
- borderpadfloat, default: :rc:`legend.borderpad`
The fractional whitespace inside the legend border, in font-size units.
- labelspacingfloat, default: :rc:`legend.labelspacing`
The vertical space between the legend entries, in font-size units.
- handlelengthfloat, default: :rc:`legend.handlelength`
The length of the legend handles, in font-size units.
- handleheightfloat, default: :rc:`legend.handleheight`
The height of the legend handles, in font-size units.
- handletextpadfloat, default: :rc:`legend.handletextpad`
The pad between the legend handle and text, in font-size units.
- borderaxespadfloat, default: :rc:`legend.borderaxespad`
The pad between the axes and legend border, in font-size units.
- columnspacingfloat, default: :rc:`legend.columnspacing`
The spacing between columns, in font-size units.
- handler_mapdict or None
The custom dictionary mapping instances or types to a legend handler. This handler_map updates the default handler map found at matplotlib.legend.Legend.get_legend_handler_map.
See Also
.Figure.legend
Notes
Some artists are not supported by this function. See /tutorials/intermediate/legend_guide for details.
Examples
- locator_params(axis='both', tight=None, **kwargs)
Control behavior of major tick locators.
Because the locator is involved in autoscaling, ~.Axes.autoscale_view is called automatically after the parameters are changed.
Parameters
- axis{‘both’, ‘x’, ‘y’}, default: ‘both’
The axis on which to operate. (For 3D Axes, axis can also be set to ‘z’, and ‘both’ refers to all three axes.)
- tightbool or None, optional
Parameter passed to ~.Axes.autoscale_view. Default is None, for no change.
Other Parameters
- **kwargs
Remaining keyword arguments are passed to directly to the
set_params()method of the locator. Supported keywords depend on the type of the locator. See for example ~.ticker.MaxNLocator.set_params for the .ticker.MaxNLocator used by default for linear.
Examples
When plotting small subplots, one might want to reduce the maximum number of ticks and use tight bounds, for example:
ax.locator_params(tight=True, nbins=4)
- loglog(*args, **kwargs)[source]
Make a plot with log scaling on both the x and y axis.
Call signatures:
loglog([x], y, [fmt], data=None, **kwargs)
loglog([x], y, [fmt], [x2], y2, [fmt2], ..., **kwargs)
This is just a thin wrapper around .plot which additionally changes both the x-axis and the y-axis to log scaling. All of the concepts and parameters of plot can be used here as well.
The additional parameters base, subs and nonpositive control the x/y-axis properties. They are just forwarded to .Axes.set_xscale and .Axes.set_yscale. To use different properties on the x-axis and the y-axis, use e.g.
ax.set_xscale("log", base=10); ax.set_yscale("log", base=2).Parameters
- basefloat, default: 10
Base of the logarithm.
- subssequence, optional
The location of the minor ticks. If None, reasonable locations are automatically chosen depending on the number of decades in the plot. See .Axes.set_xscale/.Axes.set_yscale for details.
- nonpositive{‘mask’, ‘clip’}, default: ‘mask’
Non-positive values can be masked as invalid, or clipped to a very small positive number.
- **kwargs
All parameters supported by .plot.
Returns
- list of .Line2D
Objects representing the plotted data.
- magnitude_spectrum(x, Fs=None, Fc=None, window=None, pad_to=None, sides=None, scale=None, *, data=None, **kwargs)[source]
Plot the magnitude spectrum.
Compute the magnitude spectrum of x. Data is padded to a length of pad_to and the windowing function window is applied to the signal.
Parameters
- x1-D array or sequence
Array or sequence containing the data.
- Fsfloat, default: 2
The sampling frequency (samples per time unit). It is used to calculate the Fourier frequencies, freqs, in cycles per time unit.
- windowcallable or ndarray, default: .window_hanning
A function or a vector of length NFFT. To create window vectors see .window_hanning, .window_none, numpy.blackman, numpy.hamming, numpy.bartlett, scipy.signal, scipy.signal.get_window, etc. If a function is passed as the argument, it must take a data segment as an argument and return the windowed version of the segment.
- sides{‘default’, ‘onesided’, ‘twosided’}, optional
Which sides of the spectrum to return. ‘default’ is one-sided for real data and two-sided for complex data. ‘onesided’ forces the return of a one-sided spectrum, while ‘twosided’ forces two-sided.
- pad_toint, optional
The number of points to which the data segment is padded when performing the FFT. While not increasing the actual resolution of the spectrum (the minimum distance between resolvable peaks), this can give more points in the plot, allowing for more detail. This corresponds to the n parameter in the call to ~numpy.fft.fft. The default is None, which sets pad_to equal to the length of the input signal (i.e. no padding).
- scale{‘default’, ‘linear’, ‘dB’}
The scaling of the values in the spec. ‘linear’ is no scaling. ‘dB’ returns the values in dB scale, i.e., the dB amplitude (20 * log10). ‘default’ is ‘linear’.
- Fcint, default: 0
The center frequency of x, which offsets the x extents of the plot to reflect the frequency range used when a signal is acquired and then filtered and downsampled to baseband.
Returns
- spectrum1-D array
The values for the magnitude spectrum before scaling (real valued).
- freqs1-D array
The frequencies corresponding to the elements in spectrum.
- line~matplotlib.lines.Line2D
The line created by this function.
Other Parameters
- dataindexable object, optional
If given, the following parameters also accept a string
s, which is interpreted asdata[s](unless this raises an exception):x
- **kwargs
Keyword arguments control the .Line2D properties:
Properties: agg_filter: a filter function, which takes a (m, n, 3) float array and a dpi value, and returns a (m, n, 3) array and two offsets from the bottom left corner of the image alpha: scalar or None animated: bool antialiased or aa: bool clip_box: .Bbox clip_on: bool clip_path: Patch or (Path, Transform) or None color or c: color dash_capstyle: .CapStyle or {‘butt’, ‘projecting’, ‘round’} dash_joinstyle: .JoinStyle or {‘miter’, ‘round’, ‘bevel’} dashes: sequence of floats (on/off ink in points) or (None, None) data: (2, N) array or two 1D arrays drawstyle or ds: {‘default’, ‘steps’, ‘steps-pre’, ‘steps-mid’, ‘steps-post’}, default: ‘default’ figure: .Figure fillstyle: {‘full’, ‘left’, ‘right’, ‘bottom’, ‘top’, ‘none’} gapcolor: color or None gid: str in_layout: bool label: object linestyle or ls: {‘-’, ‘–’, ‘-.’, ‘:’, ‘’, (offset, on-off-seq), …} linewidth or lw: float marker: marker style string, ~.path.Path or ~.markers.MarkerStyle markeredgecolor or mec: color markeredgewidth or mew: float markerfacecolor or mfc: color markerfacecoloralt or mfcalt: color markersize or ms: float markevery: None or int or (int, int) or slice or list[int] or float or (float, float) or list[bool] mouseover: bool path_effects: .AbstractPathEffect picker: float or callable[[Artist, Event], tuple[bool, dict]] pickradius: unknown rasterized: bool sketch_params: (scale: float, length: float, randomness: float) snap: bool or None solid_capstyle: .CapStyle or {‘butt’, ‘projecting’, ‘round’} solid_joinstyle: .JoinStyle or {‘miter’, ‘round’, ‘bevel’} transform: unknown url: str visible: bool xdata: 1D array ydata: 1D array zorder: float
See Also
- psd
Plots the power spectral density.
- angle_spectrum
Plots the angles of the corresponding frequencies.
- phase_spectrum
Plots the phase (unwrapped angle) of the corresponding frequencies.
- specgram
Can plot the magnitude spectrum of segments within the signal in a colormap.
- margins(*margins, x=None, y=None, tight=True)
Set or retrieve autoscaling margins.
The padding added to each limit of the Axes is the margin times the data interval. All input parameters must be floats within the range [0, 1]. Passing both positional and keyword arguments is invalid and will raise a TypeError. If no arguments (positional or otherwise) are provided, the current margins will remain in place and simply be returned.
Specifying any margin changes only the autoscaling; for example, if xmargin is not None, then xmargin times the X data interval will be added to each end of that interval before it is used in autoscaling.
Parameters
- *marginsfloat, optional
If a single positional argument is provided, it specifies both margins of the x-axis and y-axis limits. If two positional arguments are provided, they will be interpreted as xmargin, ymargin. If setting the margin on a single axis is desired, use the keyword arguments described below.
- x, yfloat, optional
Specific margin values for the x-axis and y-axis, respectively. These cannot be used with positional arguments, but can be used individually to alter on e.g., only the y-axis.
- tightbool or None, default: True
The tight parameter is passed to ~.axes.Axes.autoscale_view, which is executed after a margin is changed; the default here is True, on the assumption that when margins are specified, no additional padding to match tick marks is usually desired. Setting tight to None preserves the previous setting.
Returns
xmargin, ymargin : float
Notes
If a previously used Axes method such as
pcolor()has setuse_sticky_edgesto True, only the limits not set by the “sticky artists” will be modified. To force all of the margins to be set, setuse_sticky_edgesto False before callingmargins().
- matshow(Z, **kwargs)[source]
Plot the values of a 2D matrix or array as color-coded image.
The matrix will be shown the way it would be printed, with the first row at the top. Row and column numbering is zero-based.
Parameters
- Z(M, N) array-like
The matrix to be displayed.
Returns
~matplotlib.image.AxesImage
Other Parameters
**kwargs : ~matplotlib.axes.Axes.imshow arguments
See Also
imshow : More general function to plot data on a 2D regular raster.
Notes
This is just a convenience function wrapping .imshow to set useful defaults for displaying a matrix. In particular:
Set
origin='upper'.Set
interpolation='nearest'.Set
aspect='equal'.Ticks are placed to the left and above.
Ticks are formatted to show integer indices.
- minorticks_off()
Remove minor ticks from the Axes.
- minorticks_on()
Display minor ticks on the Axes.
Displaying minor ticks may reduce performance; you may turn them off using minorticks_off() if drawing speed is a problem.
- property mouseover
Return whether this artist is queried for custom context information when the mouse cursor moves over it.
- pchanged()
Call all of the registered callbacks.
This function is triggered internally when a property is changed.
See Also
add_callback remove_callback
- pcolor(*args, shading=None, alpha=None, norm=None, cmap=None, vmin=None, vmax=None, data=None, **kwargs)[source]
Create a pseudocolor plot with a non-regular rectangular grid.
Call signature:
pcolor([X, Y,] C, **kwargs)
X and Y can be used to specify the corners of the quadrilaterals.
Hint
pcolor()can be very slow for large arrays. In most cases you should use the similar but much faster ~.Axes.pcolormesh instead. See Differences between pcolor() and pcolormesh() for a discussion of the differences.Parameters
- C2D array-like
The color-mapped values. Color-mapping is controlled by cmap, norm, vmin, and vmax.
- X, Yarray-like, optional
The coordinates of the corners of quadrilaterals of a pcolormesh:
(X[i+1, j], Y[i+1, j])       (X[i+1, j+1], Y[i+1, j+1])
                      +-----+
                      |     |
                      +-----+
    (X[i, j], Y[i, j])       (X[i, j+1], Y[i, j+1])
Note that the column index corresponds to the x-coordinate, and the row index corresponds to y. For details, see the Notes section below.
If
shading='flat'the dimensions of X and Y should be one greater than those of C, and the quadrilateral is colored due to the value atC[i, j]. If X, Y and C have equal dimensions, a warning will be raised and the last row and column of C will be ignored.If
shading='nearest', the dimensions of X and Y should be the same as those of C (if not, a ValueError will be raised). The colorC[i, j]will be centered on(X[i, j], Y[i, j]).If X and/or Y are 1-D arrays or column vectors they will be expanded as needed into the appropriate 2D arrays, making a rectangular grid.
- shading{‘flat’, ‘nearest’, ‘auto’}, default: :rc:`pcolor.shading`
The fill style for the quadrilateral. Possible values:
‘flat’: A solid color is used for each quad. The color of the quad (i, j), (i+1, j), (i, j+1), (i+1, j+1) is given by
C[i, j]. The dimensions of X and Y should be one greater than those of C; if they are the same as C, then a deprecation warning is raised, and the last row and column of C are dropped.‘nearest’: Each grid point will have a color centered on it, extending halfway between the adjacent grid centers. The dimensions of X and Y must be the same as C.
‘auto’: Choose ‘flat’ if dimensions of X and Y are one larger than C. Choose ‘nearest’ if dimensions are the same.
See /gallery/images_contours_and_fields/pcolormesh_grids for more description.
- cmapstr or ~matplotlib.colors.Colormap, default: :rc:`image.cmap`
The Colormap instance or registered colormap name used to map scalar data to colors.
- normstr or ~matplotlib.colors.Normalize, optional
The normalization method used to scale scalar data to the [0, 1] range before mapping to colors using cmap. By default, a linear scaling is used, mapping the lowest value to 0 and the highest to 1.
If given, this can be one of the following:
An instance of .Normalize or one of its subclasses (see /tutorials/colors/colormapnorms).
A scale name, i.e. one of “linear”, “log”, “symlog”, “logit”, etc. For a list of available scales, call matplotlib.scale.get_scale_names(). In that case, a suitable .Normalize subclass is dynamically generated and instantiated.
- vmin, vmaxfloat, optional
When using scalar data and no explicit norm, vmin and vmax define the data range that the colormap covers. By default, the colormap covers the complete value range of the supplied data. It is an error to use vmin/vmax when a norm instance is given (but using a str norm name together with vmin/vmax is acceptable).
- edgecolors{‘none’, None, ‘face’, color, color sequence}, optional
The color of the edges. Defaults to ‘none’. Possible values:
‘none’ or ‘’: No edge.
None: :rc:`patch.edgecolor` will be used. Note that currently :rc:`patch.force_edgecolor` has to be True for this to work.
‘face’: Use the adjacent face color.
A color or sequence of colors will set the edge color.
The singular form edgecolor works as an alias.
- alphafloat, default: None
The alpha blending value of the face color, between 0 (transparent) and 1 (opaque). Note: The edgecolor is currently not affected by this.
- snapbool, default: False
Whether to snap the mesh to pixel boundaries.
Returns
matplotlib.collections.Collection
Other Parameters
- antialiasedsbool, default: False
The default antialiaseds is False if the default edgecolors=”none” is used. This eliminates artificial lines at patch boundaries, and works regardless of the value of alpha. If edgecolors is not “none”, then the default antialiaseds is taken from :rc:`patch.antialiased`. Stroking the edges may be preferred if alpha is 1, but will cause artifacts otherwise.
- dataindexable object, optional
If given, all parameters also accept a string
s, which is interpreted asdata[s](unless this raises an exception).- **kwargs
Additionally, the following arguments are allowed. They are passed along to the ~matplotlib.collections.PolyCollection constructor:
- Properties:
agg_filter: a filter function, which takes a (m, n, 3) float array and a dpi value, and returns a (m, n, 3) array and two offsets from the bottom left corner of the image alpha: array-like or scalar or None animated: bool antialiased or aa or antialiaseds: bool or list of bools array: array-like or None capstyle: .CapStyle or {‘butt’, ‘projecting’, ‘round’} clim: (vmin: float, vmax: float) clip_box: .Bbox clip_on: bool clip_path: Patch or (Path, Transform) or None cmap: .Colormap or str or None color: color or list of rgba tuples edgecolor or ec or edgecolors: color or list of colors or ‘face’ facecolor or facecolors or fc: color or list of colors figure: .Figure gid: str hatch: {‘/’, ‘\’, ‘|’, ‘-’, ‘+’, ‘x’, ‘o’, ‘O’, ‘.’, ‘*’} in_layout: bool joinstyle: .JoinStyle or {‘miter’, ‘round’, ‘bevel’} label: object linestyle or dashes or linestyles or ls: str or tuple or list thereof linewidth or linewidths or lw: float or list of floats mouseover: bool norm: .Normalize or str or None offset_transform or transOffset: unknown offsets: (N, 2) or (2,) array-like path_effects: .AbstractPathEffect paths: list of array-like picker: None or bool or float or callable pickradius: unknown rasterized: bool sizes: ndarray or None sketch_params: (scale: float, length: float, randomness: float) snap: bool or None transform: .Transform url: str urls: list of str or None verts: list of array-like verts_and_codes: unknown visible: bool zorder: float
See Also
- pcolormeshfor an explanation of the differences between
pcolor and pcolormesh.
- imshowIf X and Y are each equidistant, ~.Axes.imshow can be a
faster alternative.
Notes
Masked arrays
X, Y and C may be masked arrays. If either
C[i, j], or one of the vertices surroundingC[i, j](X or Y at[i, j], [i+1, j], [i, j+1], [i+1, j+1]) is masked, nothing is plotted.Grid orientation
The grid orientation follows the standard matrix convention: An array C with shape (nrows, ncolumns) is plotted with the column number as X and the row number as Y.
- pcolorfast(*args, alpha=None, norm=None, cmap=None, vmin=None, vmax=None, data=None, **kwargs)[source]
Create a pseudocolor plot with a non-regular rectangular grid.
Call signature:
ax.pcolorfast([X, Y], C, /, **kwargs)
This method is similar to ~.Axes.pcolor and ~.Axes.pcolormesh. It’s designed to provide the fastest pcolor-type plotting with the Agg backend. To achieve this, it uses different algorithms internally depending on the complexity of the input grid (regular rectangular, non-regular rectangular or arbitrary quadrilateral).
Warning
This method is experimental. Compared to ~.Axes.pcolor or ~.Axes.pcolormesh it has some limitations:
It supports only flat shading (no outlines)
It lacks support for log scaling of the axes.
It does not have a have a pyplot wrapper.
Parameters
- Carray-like
The image data. Supported array shapes are:
(M, N): an image with scalar data. Color-mapping is controlled by cmap, norm, vmin, and vmax.
(M, N, 3): an image with RGB values (0-1 float or 0-255 int).
(M, N, 4): an image with RGBA values (0-1 float or 0-255 int), i.e. including transparency.
The first two dimensions (M, N) define the rows and columns of the image.
This parameter can only be passed positionally.
- X, Ytuple or array-like, default:
(0, N),(0, M) X and Y are used to specify the coordinates of the quadrilaterals. There are different ways to do this:
Use tuples
X=(xmin, xmax)andY=(ymin, ymax)to define a uniform rectangular grid.The tuples define the outer edges of the grid. All individual quadrilaterals will be of the same size. This is the fastest version.
Use 1D arrays X, Y to specify a non-uniform rectangular grid.
In this case X and Y have to be monotonic 1D arrays of length N+1 and M+1, specifying the x and y boundaries of the cells.
The speed is intermediate. Note: The grid is checked, and if found to be uniform the fast version is used.
Use 2D arrays X, Y if you need an arbitrary quadrilateral grid (i.e. if the quadrilaterals are not rectangular).
In this case X and Y are 2D arrays with shape (M + 1, N + 1), specifying the x and y coordinates of the corners of the colored quadrilaterals.
This is the most general, but the slowest to render. It may produce faster and more compact output using ps, pdf, and svg backends, however.
These arguments can only be passed positionally.
- cmapstr or ~matplotlib.colors.Colormap, default: :rc:`image.cmap`
The Colormap instance or registered colormap name used to map scalar data to colors.
This parameter is ignored if C is RGB(A).
- normstr or ~matplotlib.colors.Normalize, optional
The normalization method used to scale scalar data to the [0, 1] range before mapping to colors using cmap. By default, a linear scaling is used, mapping the lowest value to 0 and the highest to 1.
If given, this can be one of the following:
An instance of .Normalize or one of its subclasses (see /tutorials/colors/colormapnorms).
A scale name, i.e. one of “linear”, “log”, “symlog”, “logit”, etc. For a list of available scales, call matplotlib.scale.get_scale_names(). In that case, a suitable .Normalize subclass is dynamically generated and instantiated.
This parameter is ignored if C is RGB(A).
- vmin, vmaxfloat, optional
When using scalar data and no explicit norm, vmin and vmax define the data range that the colormap covers. By default, the colormap covers the complete value range of the supplied data. It is an error to use vmin/vmax when a norm instance is given (but using a str norm name together with vmin/vmax is acceptable).
This parameter is ignored if C is RGB(A).
- alphafloat, default: None
The alpha blending value, between 0 (transparent) and 1 (opaque).
- snapbool, default: False
Whether to snap the mesh to pixel boundaries.
Returns
- .AxesImage or .PcolorImage or .QuadMesh
The return type depends on the type of grid:
.AxesImage for a regular rectangular grid.
.PcolorImage for a non-regular rectangular grid.
.QuadMesh for a non-rectangular grid.
Other Parameters
- dataindexable object, optional
If given, all parameters also accept a string
s, which is interpreted asdata[s](unless this raises an exception).- **kwargs
Supported additional parameters depend on the type of grid. See return types of image for further description.
- pcolormesh(*args, alpha=None, norm=None, cmap=None, vmin=None, vmax=None, shading=None, antialiased=False, data=None, **kwargs)[source]
Create a pseudocolor plot with a non-regular rectangular grid.
Call signature:
pcolormesh([X, Y,] C, **kwargs)
X and Y can be used to specify the corners of the quadrilaterals.
Hint
~.Axes.pcolormesh is similar to ~.Axes.pcolor. It is much faster and preferred in most cases. For a detailed discussion on the differences see Differences between pcolor() and pcolormesh().
Parameters
- C2D array-like
The color-mapped values. Color-mapping is controlled by cmap, norm, vmin, and vmax.
- X, Yarray-like, optional
The coordinates of the corners of quadrilaterals of a pcolormesh:
(X[i+1, j], Y[i+1, j])       (X[i+1, j+1], Y[i+1, j+1])
                      +-----+
                      |     |
                      +-----+
    (X[i, j], Y[i, j])       (X[i, j+1], Y[i, j+1])
Note that the column index corresponds to the x-coordinate, and the row index corresponds to y. For details, see the Notes section below.
If
shading='flat'the dimensions of X and Y should be one greater than those of C, and the quadrilateral is colored due to the value atC[i, j]. If X, Y and C have equal dimensions, a warning will be raised and the last row and column of C will be ignored.If
shading='nearest'or'gouraud', the dimensions of X and Y should be the same as those of C (if not, a ValueError will be raised). For'nearest'the colorC[i, j]is centered on(X[i, j], Y[i, j]). For'gouraud', a smooth interpolation is caried out between the quadrilateral corners.If X and/or Y are 1-D arrays or column vectors they will be expanded as needed into the appropriate 2D arrays, making a rectangular grid.
- cmapstr or ~matplotlib.colors.Colormap, default: :rc:`image.cmap`
The Colormap instance or registered colormap name used to map scalar data to colors.
- normstr or ~matplotlib.colors.Normalize, optional
The normalization method used to scale scalar data to the [0, 1] range before mapping to colors using cmap. By default, a linear scaling is used, mapping the lowest value to 0 and the highest to 1.
If given, this can be one of the following:
An instance of .Normalize or one of its subclasses (see /tutorials/colors/colormapnorms).
A scale name, i.e. one of “linear”, “log”, “symlog”, “logit”, etc. For a list of available scales, call matplotlib.scale.get_scale_names(). In that case, a suitable .Normalize subclass is dynamically generated and instantiated.
- vmin, vmaxfloat, optional
When using scalar data and no explicit norm, vmin and vmax define the data range that the colormap covers. By default, the colormap covers the complete value range of the supplied data. It is an error to use vmin/vmax when a norm instance is given (but using a str norm name together with vmin/vmax is acceptable).
- edgecolors{‘none’, None, ‘face’, color, color sequence}, optional
The color of the edges. Defaults to ‘none’. Possible values:
‘none’ or ‘’: No edge.
None: :rc:`patch.edgecolor` will be used. Note that currently :rc:`patch.force_edgecolor` has to be True for this to work.
‘face’: Use the adjacent face color.
A color or sequence of colors will set the edge color.
The singular form edgecolor works as an alias.
- alphafloat, default: None
The alpha blending value, between 0 (transparent) and 1 (opaque).
- shading{‘flat’, ‘nearest’, ‘gouraud’, ‘auto’}, optional
The fill style for the quadrilateral; defaults to ‘flat’ or :rc:`pcolor.shading`. Possible values:
‘flat’: A solid color is used for each quad. The color of the quad (i, j), (i+1, j), (i, j+1), (i+1, j+1) is given by
C[i, j]. The dimensions of X and Y should be one greater than those of C; if they are the same as C, then a deprecation warning is raised, and the last row and column of C are dropped.‘nearest’: Each grid point will have a color centered on it, extending halfway between the adjacent grid centers. The dimensions of X and Y must be the same as C.
‘gouraud’: Each quad will be Gouraud shaded: The color of the corners (i’, j’) are given by
C[i', j']. The color values of the area in between is interpolated from the corner values. The dimensions of X and Y must be the same as C. When Gouraud shading is used, edgecolors is ignored.‘auto’: Choose ‘flat’ if dimensions of X and Y are one larger than C. Choose ‘nearest’ if dimensions are the same.
See /gallery/images_contours_and_fields/pcolormesh_grids for more description.
- snapbool, default: False
Whether to snap the mesh to pixel boundaries.
- rasterizedbool, optional
Rasterize the pcolormesh when drawing vector graphics. This can speed up rendering and produce smaller files for large data sets. See also /gallery/misc/rasterization_demo.
Returns
matplotlib.collections.QuadMesh
Other Parameters
- dataindexable object, optional
If given, all parameters also accept a string
s, which is interpreted asdata[s](unless this raises an exception).- **kwargs
Additionally, the following arguments are allowed. They are passed along to the ~matplotlib.collections.QuadMesh constructor:
- Properties:
agg_filter: a filter function, which takes a (m, n, 3) float array and a dpi value, and returns a (m, n, 3) array and two offsets from the bottom left corner of the image alpha: array-like or scalar or None animated: bool antialiased or aa or antialiaseds: bool or list of bools array: (M, N) array-like or M*N array-like capstyle: .CapStyle or {‘butt’, ‘projecting’, ‘round’} clim: (vmin: float, vmax: float) clip_box: .Bbox clip_on: bool clip_path: Patch or (Path, Transform) or None cmap: .Colormap or str or None color: color or list of rgba tuples edgecolor or ec or edgecolors: color or list of colors or ‘face’ facecolor or facecolors or fc: color or list of colors figure: .Figure gid: str hatch: {‘/’, ‘\’, ‘|’, ‘-’, ‘+’, ‘x’, ‘o’, ‘O’, ‘.’, ‘*’} in_layout: bool joinstyle: .JoinStyle or {‘miter’, ‘round’, ‘bevel’} label: object linestyle or dashes or linestyles or ls: str or tuple or list thereof linewidth or linewidths or lw: float or list of floats mouseover: bool norm: .Normalize or str or None offset_transform or transOffset: unknown offsets: (N, 2) or (2,) array-like path_effects: .AbstractPathEffect picker: None or bool or float or callable pickradius: unknown rasterized: bool sketch_params: (scale: float, length: float, randomness: float) snap: bool or None transform: .Transform url: str urls: list of str or None visible: bool zorder: float
See Also
- pcolorAn alternative implementation with slightly different
features. For a detailed discussion on the differences see Differences between pcolor() and pcolormesh().
- imshowIf X and Y are each equidistant, ~.Axes.imshow can be a
faster alternative.
Notes
Masked arrays
C may be a masked array. If
C[i, j]is masked, the corresponding quadrilateral will be transparent. Masking of X and Y is not supported. Use ~.Axes.pcolor if you need this functionality.Grid orientation
The grid orientation follows the standard matrix convention: An array C with shape (nrows, ncolumns) is plotted with the column number as X and the row number as Y.
Differences between pcolor() and pcolormesh()
Both methods are used to create a pseudocolor plot of a 2D array using quadrilaterals.
The main difference lies in the created object and internal data handling: While ~.Axes.pcolor returns a .PolyCollection, ~.Axes.pcolormesh returns a .QuadMesh. The latter is more specialized for the given purpose and thus is faster. It should almost always be preferred.
There is also a slight difference in the handling of masked arrays. Both ~.Axes.pcolor and ~.Axes.pcolormesh support masked arrays for C. However, only ~.Axes.pcolor supports masked arrays for X and Y. The reason lies in the internal handling of the masked values. ~.Axes.pcolor leaves out the respective polygons from the PolyCollection. ~.Axes.pcolormesh sets the facecolor of the masked elements to transparent. You can see the difference when using edgecolors. While all edges are drawn irrespective of masking in a QuadMesh, the edge between two adjacent masked quadrilaterals in ~.Axes.pcolor is not drawn as the corresponding polygons do not exist in the PolyCollection.
Another difference is the support of Gouraud shading in ~.Axes.pcolormesh, which is not available with ~.Axes.pcolor.
- phase_spectrum(x, Fs=None, Fc=None, window=None, pad_to=None, sides=None, *, data=None, **kwargs)[source]
Plot the phase spectrum.
Compute the phase spectrum (unwrapped angle spectrum) of x. Data is padded to a length of pad_to and the windowing function window is applied to the signal.
Parameters
- x1-D array or sequence
Array or sequence containing the data
- Fsfloat, default: 2
The sampling frequency (samples per time unit). It is used to calculate the Fourier frequencies, freqs, in cycles per time unit.
- windowcallable or ndarray, default: .window_hanning
A function or a vector of length NFFT. To create window vectors see .window_hanning, .window_none, numpy.blackman, numpy.hamming, numpy.bartlett, scipy.signal, scipy.signal.get_window, etc. If a function is passed as the argument, it must take a data segment as an argument and return the windowed version of the segment.
- sides{‘default’, ‘onesided’, ‘twosided’}, optional
Which sides of the spectrum to return. ‘default’ is one-sided for real data and two-sided for complex data. ‘onesided’ forces the return of a one-sided spectrum, while ‘twosided’ forces two-sided.
- pad_toint, optional
The number of points to which the data segment is padded when performing the FFT. While not increasing the actual resolution of the spectrum (the minimum distance between resolvable peaks), this can give more points in the plot, allowing for more detail. This corresponds to the n parameter in the call to ~numpy.fft.fft. The default is None, which sets pad_to equal to the length of the input signal (i.e. no padding).
- Fcint, default: 0
The center frequency of x, which offsets the x extents of the plot to reflect the frequency range used when a signal is acquired and then filtered and downsampled to baseband.
Returns
- spectrum1-D array
The values for the phase spectrum in radians (real valued).
- freqs1-D array
The frequencies corresponding to the elements in spectrum.
- line~matplotlib.lines.Line2D
The line created by this function.
Other Parameters
- dataindexable object, optional
If given, the following parameters also accept a string
s, which is interpreted asdata[s](unless this raises an exception):x
- **kwargs
Keyword arguments control the .Line2D properties:
Properties: agg_filter: a filter function, which takes a (m, n, 3) float array and a dpi value, and returns a (m, n, 3) array and two offsets from the bottom left corner of the image alpha: scalar or None animated: bool antialiased or aa: bool clip_box: .Bbox clip_on: bool clip_path: Patch or (Path, Transform) or None color or c: color dash_capstyle: .CapStyle or {‘butt’, ‘projecting’, ‘round’} dash_joinstyle: .JoinStyle or {‘miter’, ‘round’, ‘bevel’} dashes: sequence of floats (on/off ink in points) or (None, None) data: (2, N) array or two 1D arrays drawstyle or ds: {‘default’, ‘steps’, ‘steps-pre’, ‘steps-mid’, ‘steps-post’}, default: ‘default’ figure: .Figure fillstyle: {‘full’, ‘left’, ‘right’, ‘bottom’, ‘top’, ‘none’} gapcolor: color or None gid: str in_layout: bool label: object linestyle or ls: {‘-’, ‘–’, ‘-.’, ‘:’, ‘’, (offset, on-off-seq), …} linewidth or lw: float marker: marker style string, ~.path.Path or ~.markers.MarkerStyle markeredgecolor or mec: color markeredgewidth or mew: float markerfacecolor or mfc: color markerfacecoloralt or mfcalt: color markersize or ms: float markevery: None or int or (int, int) or slice or list[int] or float or (float, float) or list[bool] mouseover: bool path_effects: .AbstractPathEffect picker: float or callable[[Artist, Event], tuple[bool, dict]] pickradius: unknown rasterized: bool sketch_params: (scale: float, length: float, randomness: float) snap: bool or None solid_capstyle: .CapStyle or {‘butt’, ‘projecting’, ‘round’} solid_joinstyle: .JoinStyle or {‘miter’, ‘round’, ‘bevel’} transform: unknown url: str visible: bool xdata: 1D array ydata: 1D array zorder: float
See Also
- magnitude_spectrum
Plots the magnitudes of the corresponding frequencies.
- angle_spectrum
Plots the wrapped version of this function.
- specgram
Can plot the phase spectrum of segments within the signal in a colormap.
- pick(mouseevent)
Process a pick event.
Each child artist will fire a pick event if mouseevent is over the artist and the artist has picker set.
See Also
set_picker, get_picker, pickable
- pie(x, explode=None, labels=None, colors=None, autopct=None, pctdistance=0.6, shadow=False, labeldistance=1.1, startangle=0, radius=1, counterclock=True, wedgeprops=None, textprops=None, center=(0, 0), frame=False, rotatelabels=False, *, normalize=True, data=None)[source]
Plot a pie chart.
Make a pie chart of array x. The fractional area of each wedge is given by
x/sum(x).The wedges are plotted counterclockwise, by default starting from the x-axis.
Parameters
- x1D array-like
The wedge sizes.
- explodearray-like, default: None
If not None, is a
len(x)array which specifies the fraction of the radius with which to offset each wedge.- labelslist, default: None
A sequence of strings providing the labels for each wedge
- colorsarray-like, default: None
A sequence of colors through which the pie chart will cycle. If None, will use the colors in the currently active cycle.
- autopctNone or str or callable, default: None
If not None, is a string or function used to label the wedges with their numeric value. The label will be placed inside the wedge. If it is a format string, the label will be
fmt % pct. If it is a function, it will be called.- pctdistancefloat, default: 0.6
The ratio between the center of each pie slice and the start of the text generated by autopct. Ignored if autopct is None.
- shadowbool, default: False
Draw a shadow beneath the pie.
- normalizebool, default: True
When True, always make a full pie by normalizing x so that
sum(x) == 1. False makes a partial pie ifsum(x) <= 1and raises a ValueError forsum(x) > 1.- labeldistancefloat or None, default: 1.1
The radial distance at which the pie labels are drawn. If set to
None, label are not drawn, but are stored for use inlegend()- startanglefloat, default: 0 degrees
The angle by which the start of the pie is rotated, counterclockwise from the x-axis.
- radiusfloat, default: 1
The radius of the pie.
- counterclockbool, default: True
Specify fractions direction, clockwise or counterclockwise.
- wedgepropsdict, default: None
Dict of arguments passed to the wedge objects making the pie. For example, you can pass in
wedgeprops = {'linewidth': 3}to set the width of the wedge border lines equal to 3. For more details, look at the doc/arguments of the wedge object. By defaultclip_on=False.- textpropsdict, default: None
Dict of arguments to pass to the text objects.
- center(float, float), default: (0, 0)
The coordinates of the center of the chart.
- framebool, default: False
Plot Axes frame with the chart if true.
- rotatelabelsbool, default: False
Rotate each label to the angle of the corresponding slice if true.
- dataindexable object, optional
If given, the following parameters also accept a string
s, which is interpreted asdata[s](unless this raises an exception):x, explode, labels, colors
Returns
- patcheslist
A sequence of matplotlib.patches.Wedge instances
- textslist
A list of the label .Text instances.
- autotextslist
A list of .Text instances for the numeric labels. This will only be returned if the parameter autopct is not None.
Notes
The pie chart will probably look best if the figure and Axes are square, or the Axes aspect is equal. This method sets the aspect ratio of the axis to “equal”. The Axes aspect ratio can be controlled with .Axes.set_aspect.
- plot(*args, scalex=True, scaley=True, data=None, **kwargs)[source]
Plot y versus x as lines and/or markers.
Call signatures:
plot([x], y, [fmt], *, data=None, **kwargs)
plot([x], y, [fmt], [x2], y2, [fmt2], ..., **kwargs)
The coordinates of the points or line nodes are given by x, y.
The optional parameter fmt is a convenient way for defining basic formatting like color, marker and linestyle. It’s a shortcut string notation described in the Notes section below.
>>> plot(x, y)        # plot x and y using default line style and color
>>> plot(x, y, 'bo')  # plot x and y using blue circle markers
>>> plot(y)           # plot y using x as index array 0..N-1
>>> plot(y, 'r+')     # ditto, but with red plusses
You can use .Line2D properties as keyword arguments for more control on the appearance. Line properties and fmt can be mixed. The following two calls yield identical results:
>>> plot(x, y, 'go--', linewidth=2, markersize=12)
>>> plot(x, y, color='green', marker='o', linestyle='dashed',
...      linewidth=2, markersize=12)
When conflicting with fmt, keyword arguments take precedence.
Plotting labelled data
There’s a convenient way for plotting objects with labelled data (i.e. data that can be accessed by index
obj['y']). Instead of giving the data in x and y, you can provide the object in the data parameter and just give the labels for x and y:>>> plot('xlabel', 'ylabel', data=obj)
All indexable objects are supported. This could e.g. be a dict, a pandas.DataFrame or a structured numpy array.
Plotting multiple sets of data
There are various ways to plot multiple sets of data.
The most straight forward way is just to call plot multiple times. Example:
>>> plot(x1, y1, 'bo')
>>> plot(x2, y2, 'go')
If x and/or y are 2D arrays a separate data set will be drawn for every column. If both x and y are 2D, they must have the same shape. If only one of them is 2D with shape (N, m) the other must have length N and will be used for every data set m.
Example:
>>> x = [1, 2, 3]
>>> y = np.array([[1, 2], [3, 4], [5, 6]])
>>> plot(x, y)
is equivalent to:
>>> for col in range(y.shape[1]):
...     plot(x, y[:, col])
The third way is to specify multiple sets of [x], y, [fmt] groups:
>>> plot(x1, y1, 'g^', x2, y2, 'g-')
In this case, any additional keyword argument applies to all datasets. Also this syntax cannot be combined with the data parameter.
By default, each line is assigned a different style specified by a ‘style cycle’. The fmt and line property parameters are only necessary if you want explicit deviations from these defaults. Alternatively, you can also change the style cycle using :rc:`axes.prop_cycle`.
Parameters
- x, yarray-like or scalar
The horizontal / vertical coordinates of the data points. x values are optional and default to
range(len(y)).Commonly, these parameters are 1D arrays.
They can also be scalars, or two-dimensional (in that case, the columns represent separate data sets).
These arguments cannot be passed as keywords.
- fmtstr, optional
A format string, e.g. ‘ro’ for red circles. See the Notes section for a full description of the format strings.
Format strings are just an abbreviation for quickly setting basic line properties. All of these and more can also be controlled by keyword arguments.
This argument cannot be passed as keyword.
- dataindexable object, optional
An object with labelled data. If given, provide the label names to plot in x and y.
Note
Technically there’s a slight ambiguity in calls where the second label is a valid fmt.
plot('n', 'o', data=obj)could beplt(x, y)orplt(y, fmt). In such cases, the former interpretation is chosen, but a warning is issued. You may suppress the warning by adding an empty format stringplot('n', 'o', '', data=obj).
Returns
- list of .Line2D
A list of lines representing the plotted data.
Other Parameters
- scalex, scaleybool, default: True
These parameters determine if the view limits are adapted to the data limits. The values are passed on to ~.axes.Axes.autoscale_view.
- **kwargs.Line2D properties, optional
kwargs are used to specify properties like a line label (for auto legends), linewidth, antialiasing, marker face color. Example:
>>> plot([1, 2, 3], [1, 2, 3], 'go-', label='line 1', linewidth=2)
>>> plot([1, 2, 3], [1, 4, 9], 'rs', label='line 2')
If you specify multiple lines with one plot call, the kwargs apply to all those lines. In case the label object is iterable, each element is used as labels for each set of data.
Here is a list of available .Line2D properties:
Properties: agg_filter: a filter function, which takes a (m, n, 3) float array and a dpi value, and returns a (m, n, 3) array and two offsets from the bottom left corner of the image alpha: scalar or None animated: bool antialiased or aa: bool clip_box: .Bbox clip_on: bool clip_path: Patch or (Path, Transform) or None color or c: color dash_capstyle: .CapStyle or {‘butt’, ‘projecting’, ‘round’} dash_joinstyle: .JoinStyle or {‘miter’, ‘round’, ‘bevel’} dashes: sequence of floats (on/off ink in points) or (None, None) data: (2, N) array or two 1D arrays drawstyle or ds: {‘default’, ‘steps’, ‘steps-pre’, ‘steps-mid’, ‘steps-post’}, default: ‘default’ figure: .Figure fillstyle: {‘full’, ‘left’, ‘right’, ‘bottom’, ‘top’, ‘none’} gapcolor: color or None gid: str in_layout: bool label: object linestyle or ls: {‘-’, ‘–’, ‘-.’, ‘:’, ‘’, (offset, on-off-seq), …} linewidth or lw: float marker: marker style string, ~.path.Path or ~.markers.MarkerStyle markeredgecolor or mec: color markeredgewidth or mew: float markerfacecolor or mfc: color markerfacecoloralt or mfcalt: color markersize or ms: float markevery: None or int or (int, int) or slice or list[int] or float or (float, float) or list[bool] mouseover: bool path_effects: .AbstractPathEffect picker: float or callable[[Artist, Event], tuple[bool, dict]] pickradius: unknown rasterized: bool sketch_params: (scale: float, length: float, randomness: float) snap: bool or None solid_capstyle: .CapStyle or {‘butt’, ‘projecting’, ‘round’} solid_joinstyle: .JoinStyle or {‘miter’, ‘round’, ‘bevel’} transform: unknown url: str visible: bool xdata: 1D array ydata: 1D array zorder: float
See Also
- scatterXY scatter plot with markers of varying size and/or color (
sometimes also called bubble chart).
Notes
Format Strings
A format string consists of a part for color, marker and line:
fmt = '[marker][line][color]'
Each of them is optional. If not provided, the value from the style cycle is used. Exception: If
lineis given, but nomarker, the data will be a line without markers.Other combinations such as
[color][marker][line]are also supported, but note that their parsing may be ambiguous.Markers
character
description
'.'point marker
','pixel marker
'o'circle marker
'v'triangle_down marker
'^'triangle_up marker
'<'triangle_left marker
'>'triangle_right marker
'1'tri_down marker
'2'tri_up marker
'3'tri_left marker
'4'tri_right marker
'8'octagon marker
's'square marker
'p'pentagon marker
'P'plus (filled) marker
'*'star marker
'h'hexagon1 marker
'H'hexagon2 marker
'+'plus marker
'x'x marker
'X'x (filled) marker
'D'diamond marker
'd'thin_diamond marker
'|'vline marker
'_'hline marker
Line Styles
character
description
'-'solid line style
'--'dashed line style
'-.'dash-dot line style
':'dotted line style
Example format strings:
'b'    # blue markers with default shape
'or'   # red circles
'-g'   # green solid line
'--'   # dashed line with default color
'^k:'  # black triangle_up markers connected by a dotted line
Colors
The supported color abbreviations are the single letter codes
character
color
'b'blue
'g'green
'r'red
'c'cyan
'm'magenta
'y'yellow
'k'black
'w'white
and the
'CN'colors that index into the default property cycle.If the color is the only part of the format string, you can additionally use any matplotlib.colors spec, e.g. full names (
'green') or hex strings ('#008000').
- plot_date(x, y, fmt='o', tz=None, xdate=True, ydate=False, *, data=None, **kwargs)[source]
[Discouraged] Plot coercing the axis to treat floats as dates.
Discouraged
This method exists for historic reasons and will be deprecated in the future.
datetime-like data should directly be plotted using ~.Axes.plot.If you need to plot plain numeric data as date-format or need to set a timezone, call
ax.xaxis.axis_date/ax.yaxis.axis_datebefore ~.Axes.plot. See .Axis.axis_date.
Similar to .plot, this plots y vs. x as lines or markers. However, the axis labels are formatted as dates depending on xdate and ydate. Note that .plot will work with datetime and numpy.datetime64 objects without resorting to this method.
Parameters
- x, yarray-like
The coordinates of the data points. If xdate or ydate is True, the respective values x or y are interpreted as Matplotlib dates.
- fmtstr, optional
The plot format string. For details, see the corresponding parameter in .plot.
- tztimezone string or datetime.tzinfo, default: :rc:`timezone`
The time zone to use in labeling dates.
- xdatebool, default: True
If True, the x-axis will be interpreted as Matplotlib dates.
- ydatebool, default: False
If True, the y-axis will be interpreted as Matplotlib dates.
Returns
- list of .Line2D
Objects representing the plotted data.
Other Parameters
- dataindexable object, optional
If given, the following parameters also accept a string
s, which is interpreted asdata[s](unless this raises an exception):x, y
- **kwargs
Keyword arguments control the .Line2D properties:
Properties: agg_filter: a filter function, which takes a (m, n, 3) float array and a dpi value, and returns a (m, n, 3) array and two offsets from the bottom left corner of the image alpha: scalar or None animated: bool antialiased or aa: bool clip_box: .Bbox clip_on: bool clip_path: Patch or (Path, Transform) or None color or c: color dash_capstyle: .CapStyle or {‘butt’, ‘projecting’, ‘round’} dash_joinstyle: .JoinStyle or {‘miter’, ‘round’, ‘bevel’} dashes: sequence of floats (on/off ink in points) or (None, None) data: (2, N) array or two 1D arrays drawstyle or ds: {‘default’, ‘steps’, ‘steps-pre’, ‘steps-mid’, ‘steps-post’}, default: ‘default’ figure: .Figure fillstyle: {‘full’, ‘left’, ‘right’, ‘bottom’, ‘top’, ‘none’} gapcolor: color or None gid: str in_layout: bool label: object linestyle or ls: {‘-’, ‘–’, ‘-.’, ‘:’, ‘’, (offset, on-off-seq), …} linewidth or lw: float marker: marker style string, ~.path.Path or ~.markers.MarkerStyle markeredgecolor or mec: color markeredgewidth or mew: float markerfacecolor or mfc: color markerfacecoloralt or mfcalt: color markersize or ms: float markevery: None or int or (int, int) or slice or list[int] or float or (float, float) or list[bool] mouseover: bool path_effects: .AbstractPathEffect picker: float or callable[[Artist, Event], tuple[bool, dict]] pickradius: unknown rasterized: bool sketch_params: (scale: float, length: float, randomness: float) snap: bool or None solid_capstyle: .CapStyle or {‘butt’, ‘projecting’, ‘round’} solid_joinstyle: .JoinStyle or {‘miter’, ‘round’, ‘bevel’} transform: unknown url: str visible: bool xdata: 1D array ydata: 1D array zorder: float
See Also
matplotlib.dates : Helper functions on dates. matplotlib.dates.date2num : Convert dates to num. matplotlib.dates.num2date : Convert num to dates. matplotlib.dates.drange : Create an equally spaced sequence of dates.
Notes
If you are using custom date tickers and formatters, it may be necessary to set the formatters/locators after the call to .plot_date. .plot_date will set the default tick locator to .AutoDateLocator (if the tick locator is not already set to a .DateLocator instance) and the default tick formatter to .AutoDateFormatter (if the tick formatter is not already set to a .DateFormatter instance).
- properties()
Return a dictionary of all the properties of the artist.
- psd(x, NFFT=None, Fs=None, Fc=None, detrend=None, window=None, noverlap=None, pad_to=None, sides=None, scale_by_freq=None, return_line=None, *, data=None, **kwargs)[source]
Plot the power spectral density.
The power spectral density \(P_{xx}\) by Welch’s average periodogram method. The vector x is divided into NFFT length segments. Each segment is detrended by function detrend and windowed by function window. noverlap gives the length of the overlap between segments. The \(|\mathrm{fft}(i)|^2\) of each segment \(i\) are averaged to compute \(P_{xx}\), with a scaling to correct for power loss due to windowing.
If len(x) < NFFT, it will be zero padded to NFFT.
Parameters
- x1-D array or sequence
Array or sequence containing the data
- Fsfloat, default: 2
The sampling frequency (samples per time unit). It is used to calculate the Fourier frequencies, freqs, in cycles per time unit.
- windowcallable or ndarray, default: .window_hanning
A function or a vector of length NFFT. To create window vectors see .window_hanning, .window_none, numpy.blackman, numpy.hamming, numpy.bartlett, scipy.signal, scipy.signal.get_window, etc. If a function is passed as the argument, it must take a data segment as an argument and return the windowed version of the segment.
- sides{‘default’, ‘onesided’, ‘twosided’}, optional
Which sides of the spectrum to return. ‘default’ is one-sided for real data and two-sided for complex data. ‘onesided’ forces the return of a one-sided spectrum, while ‘twosided’ forces two-sided.
- pad_toint, optional
The number of points to which the data segment is padded when performing the FFT. This can be different from NFFT, which specifies the number of data points used. While not increasing the actual resolution of the spectrum (the minimum distance between resolvable peaks), this can give more points in the plot, allowing for more detail. This corresponds to the n parameter in the call to ~numpy.fft.fft. The default is None, which sets pad_to equal to NFFT
- NFFTint, default: 256
The number of data points used in each block for the FFT. A power 2 is most efficient. This should NOT be used to get zero padding, or the scaling of the result will be incorrect; use pad_to for this instead.
- detrend{‘none’, ‘mean’, ‘linear’} or callable, default: ‘none’
The function applied to each segment before fft-ing, designed to remove the mean or linear trend. Unlike in MATLAB, where the detrend parameter is a vector, in Matplotlib it is a function. The
mlabmodule defines .detrend_none, .detrend_mean, and .detrend_linear, but you can use a custom function as well. You can also use a string to choose one of the functions: ‘none’ calls .detrend_none. ‘mean’ calls .detrend_mean. ‘linear’ calls .detrend_linear.- scale_by_freqbool, default: True
Whether the resulting density values should be scaled by the scaling frequency, which gives density in units of 1/Hz. This allows for integration over the returned frequency values. The default is True for MATLAB compatibility.
- noverlapint, default: 0 (no overlap)
The number of points of overlap between segments.
- Fcint, default: 0
The center frequency of x, which offsets the x extents of the plot to reflect the frequency range used when a signal is acquired and then filtered and downsampled to baseband.
- return_linebool, default: False
Whether to include the line object plotted in the returned values.
Returns
- Pxx1-D array
The values for the power spectrum \(P_{xx}\) before scaling (real valued).
- freqs1-D array
The frequencies corresponding to the elements in Pxx.
- line~matplotlib.lines.Line2D
The line created by this function. Only returned if return_line is True.
Other Parameters
- dataindexable object, optional
If given, the following parameters also accept a string
s, which is interpreted asdata[s](unless this raises an exception):x
- **kwargs
Keyword arguments control the .Line2D properties:
Properties: agg_filter: a filter function, which takes a (m, n, 3) float array and a dpi value, and returns a (m, n, 3) array and two offsets from the bottom left corner of the image alpha: scalar or None animated: bool antialiased or aa: bool clip_box: .Bbox clip_on: bool clip_path: Patch or (Path, Transform) or None color or c: color dash_capstyle: .CapStyle or {‘butt’, ‘projecting’, ‘round’} dash_joinstyle: .JoinStyle or {‘miter’, ‘round’, ‘bevel’} dashes: sequence of floats (on/off ink in points) or (None, None) data: (2, N) array or two 1D arrays drawstyle or ds: {‘default’, ‘steps’, ‘steps-pre’, ‘steps-mid’, ‘steps-post’}, default: ‘default’ figure: .Figure fillstyle: {‘full’, ‘left’, ‘right’, ‘bottom’, ‘top’, ‘none’} gapcolor: color or None gid: str in_layout: bool label: object linestyle or ls: {‘-’, ‘–’, ‘-.’, ‘:’, ‘’, (offset, on-off-seq), …} linewidth or lw: float marker: marker style string, ~.path.Path or ~.markers.MarkerStyle markeredgecolor or mec: color markeredgewidth or mew: float markerfacecolor or mfc: color markerfacecoloralt or mfcalt: color markersize or ms: float markevery: None or int or (int, int) or slice or list[int] or float or (float, float) or list[bool] mouseover: bool path_effects: .AbstractPathEffect picker: float or callable[[Artist, Event], tuple[bool, dict]] pickradius: unknown rasterized: bool sketch_params: (scale: float, length: float, randomness: float) snap: bool or None solid_capstyle: .CapStyle or {‘butt’, ‘projecting’, ‘round’} solid_joinstyle: .JoinStyle or {‘miter’, ‘round’, ‘bevel’} transform: unknown url: str visible: bool xdata: 1D array ydata: 1D array zorder: float
See Also
- specgram
Differs in the default overlap; in not returning the mean of the segment periodograms; in returning the times of the segments; and in plotting a colormap instead of a line.
- magnitude_spectrum
Plots the magnitude spectrum.
- csd
Plots the spectral density between two signals.
Notes
For plotting, the power is plotted as \(10\log_{10}(P_{xx})\) for decibels, though Pxx itself is returned.
References
Bendat & Piersol – Random Data: Analysis and Measurement Procedures, John Wiley & Sons (1986)
- quiver(*args, data=None, **kwargs)[source]
Plot a 2D field of arrows.
Call signature:
quiver([X, Y], U, V, [C], **kwargs)
X, Y define the arrow locations, U, V define the arrow directions, and C optionally sets the color.
Arrow length
The default settings auto-scales the length of the arrows to a reasonable size. To change this behavior see the scale and scale_units parameters.
Arrow shape
The arrow shape is determined by width, headwidth, headlength and headaxislength. See the notes below.
Arrow styling
Each arrow is internally represented by a filled polygon with a default edge linewidth of 0. As a result, an arrow is rather a filled area, not a line with a head, and .PolyCollection properties like linewidth, edgecolor, facecolor, etc. act accordingly.
Parameters
- X, Y1D or 2D array-like, optional
The x and y coordinates of the arrow locations.
If not given, they will be generated as a uniform integer meshgrid based on the dimensions of U and V.
If X and Y are 1D but U, V are 2D, X, Y are expanded to 2D using
X, Y = np.meshgrid(X, Y). In this caselen(X)andlen(Y)must match the column and row dimensions of U and V.- U, V1D or 2D array-like
The x and y direction components of the arrow vectors. The interpretation of these components (in data or in screen space) depends on angles.
U and V must have the same number of elements, matching the number of arrow locations in X, Y. U and V may be masked. Locations masked in any of U, V, and C will not be drawn.
- C1D or 2D array-like, optional
Numeric data that defines the arrow colors by colormapping via norm and cmap.
This does not support explicit colors. If you want to set colors directly, use color instead. The size of C must match the number of arrow locations.
- angles{‘uv’, ‘xy’} or array-like, default: ‘uv’
Method for determining the angle of the arrows.
‘uv’: Arrow direction in screen coordinates. Use this if the arrows symbolize a quantity that is not based on X, Y data coordinates.
If U == V the orientation of the arrow on the plot is 45 degrees counter-clockwise from the horizontal axis (positive to the right).
‘xy’: Arrow direction in data coordinates, i.e. the arrows point from (x, y) to (x+u, y+v). Use this e.g. for plotting a gradient field.
Arbitrary angles may be specified explicitly as an array of values in degrees, counter-clockwise from the horizontal axis.
In this case U, V is only used to determine the length of the arrows.
Note: inverting a data axis will correspondingly invert the arrows only with
angles='xy'.- pivot{‘tail’, ‘mid’, ‘middle’, ‘tip’}, default: ‘tail’
The part of the arrow that is anchored to the X, Y grid. The arrow rotates about this point.
‘mid’ is a synonym for ‘middle’.
- scalefloat, optional
Scales the length of the arrow inversely.
Number of data units per arrow length unit, e.g., m/s per plot width; a smaller scale parameter makes the arrow longer. Default is None.
If None, a simple autoscaling algorithm is used, based on the average vector length and the number of vectors. The arrow length unit is given by the scale_units parameter.
- scale_units{‘width’, ‘height’, ‘dots’, ‘inches’, ‘x’, ‘y’, ‘xy’}, optional
If the scale kwarg is None, the arrow length unit. Default is None.
e.g. scale_units is ‘inches’, scale is 2.0, and
(u, v) = (1, 0), then the vector will be 0.5 inches long.If scale_units is ‘width’ or ‘height’, then the vector will be half the width/height of the axes.
If scale_units is ‘x’ then the vector will be 0.5 x-axis units. To plot vectors in the x-y plane, with u and v having the same units as x and y, use
angles='xy', scale_units='xy', scale=1.- units{‘width’, ‘height’, ‘dots’, ‘inches’, ‘x’, ‘y’, ‘xy’}, default: ‘width’
Affects the arrow size (except for the length). In particular, the shaft width is measured in multiples of this unit.
Supported values are:
‘width’, ‘height’: The width or height of the Axes.
‘dots’, ‘inches’: Pixels or inches based on the figure dpi.
‘x’, ‘y’, ‘xy’: X, Y or \(\sqrt{X^2 + Y^2}\) in data units.
The following table summarizes how these values affect the visible arrow size under zooming and figure size changes:
units
zoom
figure size change
‘x’, ‘y’, ‘xy’
arrow size scales
‘width’, ‘height’
arrow size scales
‘dots’, ‘inches’
- widthfloat, optional
Shaft width in arrow units. All head parameters are relative to width.
The default depends on choice of units above, and number of vectors; a typical starting value is about 0.005 times the width of the plot.
- headwidthfloat, default: 3
Head width as multiple of shaft width. See the notes below.
- headlengthfloat, default: 5
Head length as multiple of shaft width. See the notes below.
- headaxislengthfloat, default: 4.5
Head length at shaft intersection as multiple of shaft width. See the notes below.
- minshaftfloat, default: 1
Length below which arrow scales, in units of head length. Do not set this to less than 1, or small arrows will look terrible!
- minlengthfloat, default: 1
Minimum length as a multiple of shaft width; if an arrow length is less than this, plot a dot (hexagon) of this diameter instead.
- colorcolor or color sequence, optional
Explicit color(s) for the arrows. If C has been set, color has no effect.
This is a synonym for the .PolyCollection facecolor parameter.
Other Parameters
- dataindexable object, optional
If given, all parameters also accept a string
s, which is interpreted asdata[s](unless this raises an exception).- **kwargs~matplotlib.collections.PolyCollection properties, optional
All other keyword arguments are passed on to .PolyCollection:
Properties: agg_filter: a filter function, which takes a (m, n, 3) float array and a dpi value, and returns a (m, n, 3) array and two offsets from the bottom left corner of the image alpha: array-like or scalar or None animated: bool antialiased or aa or antialiaseds: bool or list of bools array: array-like or None capstyle: .CapStyle or {‘butt’, ‘projecting’, ‘round’} clim: (vmin: float, vmax: float) clip_box: .Bbox clip_on: bool clip_path: Patch or (Path, Transform) or None cmap: .Colormap or str or None color: color or list of rgba tuples edgecolor or ec or edgecolors: color or list of colors or ‘face’ facecolor or facecolors or fc: color or list of colors figure: .Figure gid: str hatch: {‘/’, ‘\’, ‘|’, ‘-’, ‘+’, ‘x’, ‘o’, ‘O’, ‘.’, ‘*’} in_layout: bool joinstyle: .JoinStyle or {‘miter’, ‘round’, ‘bevel’} label: object linestyle or dashes or linestyles or ls: str or tuple or list thereof linewidth or linewidths or lw: float or list of floats mouseover: bool norm: .Normalize or str or None offset_transform or transOffset: unknown offsets: (N, 2) or (2,) array-like path_effects: .AbstractPathEffect paths: list of array-like picker: None or bool or float or callable pickradius: unknown rasterized: bool sizes: ndarray or None sketch_params: (scale: float, length: float, randomness: float) snap: bool or None transform: .Transform url: str urls: list of str or None verts: list of array-like verts_and_codes: unknown visible: bool zorder: float
Returns
~matplotlib.quiver.Quiver
See Also
.Axes.quiverkey : Add a key to a quiver plot.
Notes
Arrow shape
The arrow is drawn as a polygon using the nodes as shown below. The values headwidth, headlength, and headaxislength are in units of width.

The defaults give a slightly swept-back arrow. Here are some guidelines how to get other head shapes:
To make the head a triangle, make headaxislength the same as headlength.
To make the arrow more pointed, reduce headwidth or increase headlength and headaxislength.
To make the head smaller relative to the shaft, scale down all the head parameters proportionally.
To remove the head completely, set all head parameters to 0.
To get a diamond-shaped head, make headaxislength larger than headlength.
Warning: For headaxislength < (headlength / headwidth), the “headaxis” nodes (i.e. the ones connecting the head with the shaft) will protrude out of the head in forward direction so that the arrow head looks broken.
- quiverkey(Q, X, Y, U, label, **kwargs)[source]
Add a key to a quiver plot.
The positioning of the key depends on X, Y, coordinates, and labelpos. If labelpos is ‘N’ or ‘S’, X, Y give the position of the middle of the key arrow. If labelpos is ‘E’, X, Y positions the head, and if labelpos is ‘W’, X, Y positions the tail; in either of these two cases, X, Y is somewhere in the middle of the arrow+label key object.
Parameters
- Qmatplotlib.quiver.Quiver
A .Quiver object as returned by a call to ~.Axes.quiver().
- X, Yfloat
The location of the key.
- Ufloat
The length of the key.
- labelstr
The key label (e.g., length and units of the key).
- anglefloat, default: 0
The angle of the key arrow, in degrees anti-clockwise from the x-axis.
- coordinates{‘axes’, ‘figure’, ‘data’, ‘inches’}, default: ‘axes’
Coordinate system and units for X, Y: ‘axes’ and ‘figure’ are normalized coordinate systems with (0, 0) in the lower left and (1, 1) in the upper right; ‘data’ are the axes data coordinates (used for the locations of the vectors in the quiver plot itself); ‘inches’ is position in the figure in inches, with (0, 0) at the lower left corner.
- colorcolor
Overrides face and edge colors from Q.
- labelpos{‘N’, ‘S’, ‘E’, ‘W’}
Position the label above, below, to the right, to the left of the arrow, respectively.
- labelsepfloat, default: 0.1
Distance in inches between the arrow and the label.
- labelcolorcolor, default: :rc:`text.color`
Label color.
- fontpropertiesdict, optional
A dictionary with keyword arguments accepted by the ~matplotlib.font_manager.FontProperties initializer: family, style, variant, size, weight.
- **kwargs
Any additional keyword arguments are used to override vector properties taken from Q.
- redraw_in_frame()
Efficiently redraw Axes data, but not axis ticks, labels, etc.
- relim(visible_only=False)
Recompute the data limits based on current artists.
At present, .Collection instances are not supported.
Parameters
- visible_onlybool, default: False
Whether to exclude invisible artists.
- remove()
Remove the artist from the figure if possible.
The effect will not be visible until the figure is redrawn, e.g., with .FigureCanvasBase.draw_idle. Call ~.axes.Axes.relim to update the axes limits if desired.
Note: ~.axes.Axes.relim will not see collections even if the collection was added to the axes with autolim = True.
Note: there is no support for removing the artist’s legend entry.
- reset_position()
Reset the active position to the original position.
This undoes changes to the active position (as defined in .set_position) which may have been performed to satisfy fixed-aspect constraints.
- scatter(x, y, s=None, c=None, marker=None, cmap=None, norm=None, vmin=None, vmax=None, alpha=None, linewidths=None, *, edgecolors=None, plotnonfinite=False, data=None, **kwargs)[source]
A scatter plot of y vs. x with varying marker size and/or color.
Parameters
- x, yfloat or array-like, shape (n, )
The data positions.
- sfloat or array-like, shape (n, ), optional
The marker size in points**2 (typographic points are 1/72 in.). Default is
rcParams['lines.markersize'] ** 2.- carray-like or list of colors or color, optional
The marker colors. Possible values:
A scalar or sequence of n numbers to be mapped to colors using cmap and norm.
A 2D array in which the rows are RGB or RGBA.
A sequence of colors of length n.
A single color format string.
Note that c should not be a single numeric RGB or RGBA sequence because that is indistinguishable from an array of values to be colormapped. If you want to specify the same RGB or RGBA value for all points, use a 2D array with a single row. Otherwise, value- matching will have precedence in case of a size matching with x and y.
If you wish to specify a single color for all points prefer the color keyword argument.
Defaults to None. In that case the marker color is determined by the value of color, facecolor or facecolors. In case those are not specified or None, the marker color is determined by the next color of the
Axes’ current “shape and fill” color cycle. This cycle defaults to :rc:`axes.prop_cycle`.- marker~.markers.MarkerStyle, default: :rc:`scatter.marker`
The marker style. marker can be either an instance of the class or the text shorthand for a particular marker. See
matplotlib.markersfor more information about marker styles.- cmapstr or ~matplotlib.colors.Colormap, default: :rc:`image.cmap`
The Colormap instance or registered colormap name used to map scalar data to colors.
This parameter is ignored if c is RGB(A).
- normstr or ~matplotlib.colors.Normalize, optional
The normalization method used to scale scalar data to the [0, 1] range before mapping to colors using cmap. By default, a linear scaling is used, mapping the lowest value to 0 and the highest to 1.
If given, this can be one of the following:
An instance of .Normalize or one of its subclasses (see /tutorials/colors/colormapnorms).
A scale name, i.e. one of “linear”, “log”, “symlog”, “logit”, etc. For a list of available scales, call matplotlib.scale.get_scale_names(). In that case, a suitable .Normalize subclass is dynamically generated and instantiated.
This parameter is ignored if c is RGB(A).
- vmin, vmaxfloat, optional
When using scalar data and no explicit norm, vmin and vmax define the data range that the colormap covers. By default, the colormap covers the complete value range of the supplied data. It is an error to use vmin/vmax when a norm instance is given (but using a str norm name together with vmin/vmax is acceptable).
This parameter is ignored if c is RGB(A).
- alphafloat, default: None
The alpha blending value, between 0 (transparent) and 1 (opaque).
- linewidthsfloat or array-like, default: :rc:`lines.linewidth`
The linewidth of the marker edges. Note: The default edgecolors is ‘face’. You may want to change this as well.
- edgecolors{‘face’, ‘none’, None} or color or sequence of color, default: :rc:`scatter.edgecolors`
The edge color of the marker. Possible values:
‘face’: The edge color will always be the same as the face color.
‘none’: No patch boundary will be drawn.
A color or sequence of colors.
For non-filled markers, edgecolors is ignored. Instead, the color is determined like with ‘face’, i.e. from c, colors, or facecolors.
- plotnonfinitebool, default: False
Whether to plot points with nonfinite c (i.e.
inf,-infornan). IfTruethe points are drawn with the bad colormap color (see .Colormap.set_bad).
Returns
~matplotlib.collections.PathCollection
Other Parameters
- dataindexable object, optional
If given, the following parameters also accept a string
s, which is interpreted asdata[s](unless this raises an exception):x, y, s, linewidths, edgecolors, c, facecolor, facecolors, color
**kwargs : ~matplotlib.collections.Collection properties
See Also
- plotTo plot scatter plots when markers are identical in size and
color.
Notes
The .plot function will be faster for scatterplots where markers don’t vary in size or color.
Any or all of x, y, s, and c may be masked arrays, in which case all masks will be combined and only unmasked points will be plotted.
Fundamentally, scatter works with 1D arrays; x, y, s, and c may be input as N-D arrays, but within scatter they will be flattened. The exception is c, which will be flattened only if its size matches the size of x and y.
- secondary_xaxis(location, *, functions=None, **kwargs)[source]
Add a second x-axis to this Axes.
For example if we want to have a second scale for the data plotted on the xaxis.
Warnings
This method is experimental as of 3.1, and the API may change.
Parameters
- location{‘top’, ‘bottom’, ‘left’, ‘right’} or float
The position to put the secondary axis. Strings can be ‘top’ or ‘bottom’ for orientation=’x’ and ‘right’ or ‘left’ for orientation=’y’. A float indicates the relative position on the parent axes to put the new axes, 0.0 being the bottom (or left) and 1.0 being the top (or right).
functions : 2-tuple of func, or Transform with an inverse
If a 2-tuple of functions, the user specifies the transform function and its inverse. i.e.
functions=(lambda x: 2 / x, lambda x: 2 / x)would be an reciprocal transform with a factor of 2. Both functions must accept numpy arrays as input.The user can also directly supply a subclass of .transforms.Transform so long as it has an inverse.
See /gallery/subplots_axes_and_figures/secondary_axis for examples of making these conversions.
Returns
ax : axes._secondary_axes.SecondaryAxis
Other Parameters
- **kwargs~matplotlib.axes.Axes properties.
Other miscellaneous axes parameters.
Examples
The main axis shows frequency, and the secondary axis shows period.
(Source code, png, hires.png, pdf)
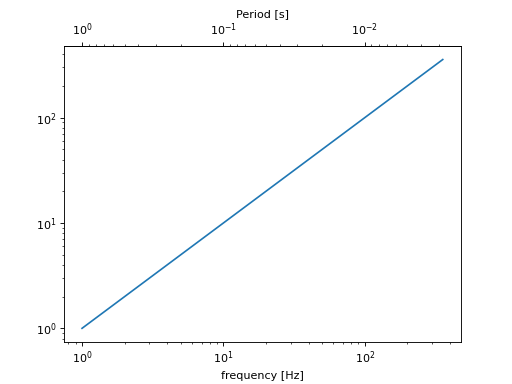
- secondary_yaxis(location, *, functions=None, **kwargs)[source]
Add a second y-axis to this Axes.
For example if we want to have a second scale for the data plotted on the yaxis.
Warnings
This method is experimental as of 3.1, and the API may change.
Parameters
- location{‘top’, ‘bottom’, ‘left’, ‘right’} or float
The position to put the secondary axis. Strings can be ‘top’ or ‘bottom’ for orientation=’x’ and ‘right’ or ‘left’ for orientation=’y’. A float indicates the relative position on the parent axes to put the new axes, 0.0 being the bottom (or left) and 1.0 being the top (or right).
functions : 2-tuple of func, or Transform with an inverse
If a 2-tuple of functions, the user specifies the transform function and its inverse. i.e.
functions=(lambda x: 2 / x, lambda x: 2 / x)would be an reciprocal transform with a factor of 2. Both functions must accept numpy arrays as input.The user can also directly supply a subclass of .transforms.Transform so long as it has an inverse.
See /gallery/subplots_axes_and_figures/secondary_axis for examples of making these conversions.
Returns
ax : axes._secondary_axes.SecondaryAxis
Other Parameters
- **kwargs~matplotlib.axes.Axes properties.
Other miscellaneous axes parameters.
Examples
Add a secondary Axes that converts from radians to degrees
(Source code, png, hires.png, pdf)

- semilogx(*args, **kwargs)[source]
Make a plot with log scaling on the x axis.
Call signatures:
semilogx([x], y, [fmt], data=None, **kwargs)
semilogx([x], y, [fmt], [x2], y2, [fmt2], ..., **kwargs)
This is just a thin wrapper around .plot which additionally changes the x-axis to log scaling. All of the concepts and parameters of plot can be used here as well.
The additional parameters base, subs, and nonpositive control the x-axis properties. They are just forwarded to .Axes.set_xscale.
Parameters
- basefloat, default: 10
Base of the x logarithm.
- subsarray-like, optional
The location of the minor xticks. If None, reasonable locations are automatically chosen depending on the number of decades in the plot. See .Axes.set_xscale for details.
- nonpositive{‘mask’, ‘clip’}, default: ‘mask’
Non-positive values in x can be masked as invalid, or clipped to a very small positive number.
- **kwargs
All parameters supported by .plot.
Returns
- list of .Line2D
Objects representing the plotted data.
- semilogy(*args, **kwargs)[source]
Make a plot with log scaling on the y axis.
Call signatures:
semilogy([x], y, [fmt], data=None, **kwargs)
semilogy([x], y, [fmt], [x2], y2, [fmt2], ..., **kwargs)
This is just a thin wrapper around .plot which additionally changes the y-axis to log scaling. All of the concepts and parameters of plot can be used here as well.
The additional parameters base, subs, and nonpositive control the y-axis properties. They are just forwarded to .Axes.set_yscale.
Parameters
- basefloat, default: 10
Base of the y logarithm.
- subsarray-like, optional
The location of the minor yticks. If None, reasonable locations are automatically chosen depending on the number of decades in the plot. See .Axes.set_yscale for details.
- nonpositive{‘mask’, ‘clip’}, default: ‘mask’
Non-positive values in y can be masked as invalid, or clipped to a very small positive number.
- **kwargs
All parameters supported by .plot.
Returns
- list of .Line2D
Objects representing the plotted data.
- set(*, adjustable=<UNSET>, agg_filter=<UNSET>, alpha=<UNSET>, anchor=<UNSET>, animated=<UNSET>, aspect=<UNSET>, autoscale_on=<UNSET>, autoscalex_on=<UNSET>, autoscaley_on=<UNSET>, axes_locator=<UNSET>, axisbelow=<UNSET>, box_aspect=<UNSET>, clip_box=<UNSET>, clip_on=<UNSET>, clip_path=<UNSET>, facecolor=<UNSET>, frame_on=<UNSET>, gid=<UNSET>, in_layout=<UNSET>, label=<UNSET>, mouseover=<UNSET>, navigate=<UNSET>, path_effects=<UNSET>, picker=<UNSET>, position=<UNSET>, prop_cycle=<UNSET>, rasterization_zorder=<UNSET>, rasterized=<UNSET>, sketch_params=<UNSET>, snap=<UNSET>, title=<UNSET>, transform=<UNSET>, url=<UNSET>, visible=<UNSET>, xbound=<UNSET>, xlabel=<UNSET>, xlim=<UNSET>, xmargin=<UNSET>, xscale=<UNSET>, xticklabels=<UNSET>, xticks=<UNSET>, ybound=<UNSET>, ylabel=<UNSET>, ylim=<UNSET>, ymargin=<UNSET>, yscale=<UNSET>, yticklabels=<UNSET>, yticks=<UNSET>, zorder=<UNSET>)
Set multiple properties at once.
Supported properties are
- Properties:
adjustable: {‘box’, ‘datalim’} agg_filter: a filter function, which takes a (m, n, 3) float array and a dpi value, and returns a (m, n, 3) array and two offsets from the bottom left corner of the image alpha: scalar or None anchor: (float, float) or {‘C’, ‘SW’, ‘S’, ‘SE’, ‘E’, ‘NE’, …} animated: bool aspect: {‘auto’, ‘equal’} or float autoscale_on: bool autoscalex_on: unknown autoscaley_on: unknown axes_locator: Callable[[Axes, Renderer], Bbox] axisbelow: bool or ‘line’ box_aspect: float or None clip_box: .Bbox clip_on: bool clip_path: Patch or (Path, Transform) or None facecolor or fc: color figure: .Figure frame_on: bool gid: str in_layout: bool label: object mouseover: bool navigate: bool navigate_mode: unknown path_effects: .AbstractPathEffect picker: None or bool or float or callable position: [left, bottom, width, height] or ~matplotlib.transforms.Bbox prop_cycle: unknown rasterization_zorder: float or None rasterized: bool sketch_params: (scale: float, length: float, randomness: float) snap: bool or None title: str transform: .Transform url: str visible: bool xbound: unknown xlabel: str xlim: (bottom: float, top: float) xmargin: float greater than -0.5 xscale: unknown xticklabels: unknown xticks: unknown ybound: unknown ylabel: str ylim: (bottom: float, top: float) ymargin: float greater than -0.5 yscale: unknown yticklabels: unknown yticks: unknown zorder: float
- set_adjustable(adjustable, share=False)
Set how the Axes adjusts to achieve the required aspect ratio.
Parameters
- adjustable{‘box’, ‘datalim’}
If ‘box’, change the physical dimensions of the Axes. If ‘datalim’, change the
xorydata limits.- sharebool, default: False
If
True, apply the settings to all shared Axes.
See Also
- matplotlib.axes.Axes.set_aspect
For a description of aspect handling.
Notes
Shared Axes (of which twinned Axes are a special case) impose restrictions on how aspect ratios can be imposed. For twinned Axes, use ‘datalim’. For Axes that share both x and y, use ‘box’. Otherwise, either ‘datalim’ or ‘box’ may be used. These limitations are partly a requirement to avoid over-specification, and partly a result of the particular implementation we are currently using, in which the adjustments for aspect ratios are done sequentially and independently on each Axes as it is drawn.
- set_agg_filter(filter_func)
Set the agg filter.
Parameters
- filter_funccallable
A filter function, which takes a (m, n, depth) float array and a dpi value, and returns a (m, n, depth) array and two offsets from the bottom left corner of the image
- set_alpha(alpha)
Set the alpha value used for blending - not supported on all backends.
Parameters
- alphascalar or None
alpha must be within the 0-1 range, inclusive.
- set_anchor(anchor, share=False)
Define the anchor location.
The actual drawing area (active position) of the Axes may be smaller than the Bbox (original position) when a fixed aspect is required. The anchor defines where the drawing area will be located within the available space.
Parameters
- anchor(float, float) or {‘C’, ‘SW’, ‘S’, ‘SE’, ‘E’, ‘NE’, …}
Either an (x, y) pair of relative coordinates (0 is left or bottom, 1 is right or top), ‘C’ (center), or a cardinal direction (‘SW’, southwest, is bottom left, etc.). str inputs are shorthands for (x, y) coordinates, as shown in the following table:
.. code-block:: none
‘NW’ (0.0, 1.0)
‘N’ (0.5, 1.0)
‘NE’ (1.0, 1.0)
‘W’ (0.0, 0.5)
‘C’ (0.5, 0.5)
‘E’ (1.0, 0.5)
‘SW’ (0.0, 0.0)
‘S’ (0.5, 0.0)
‘SE’ (1.0, 0.0)
- sharebool, default: False
If
True, apply the settings to all shared Axes.
See Also
- matplotlib.axes.Axes.set_aspect
for a description of aspect handling.
- set_animated(b)
Set whether the artist is intended to be used in an animation.
If True, the artist is excluded from regular drawing of the figure. You have to call .Figure.draw_artist / .Axes.draw_artist explicitly on the artist. This approach is used to speed up animations using blitting.
See also matplotlib.animation and /tutorials/advanced/blitting.
Parameters
b : bool
- set_aspect(aspect, adjustable=None, anchor=None, share=False)
Set the aspect ratio of the axes scaling, i.e. y/x-scale.
Parameters
- aspect{‘auto’, ‘equal’} or float
Possible values:
‘auto’: fill the position rectangle with data.
‘equal’: same as
aspect=1, i.e. same scaling for x and y.float: The displayed size of 1 unit in y-data coordinates will be aspect times the displayed size of 1 unit in x-data coordinates; e.g. for
aspect=2a square in data coordinates will be rendered with a height of twice its width.
- adjustableNone or {‘box’, ‘datalim’}, optional
If not
None, this defines which parameter will be adjusted to meet the required aspect. See .set_adjustable for further details.- anchorNone or str or (float, float), optional
If not
None, this defines where the Axes will be drawn if there is extra space due to aspect constraints. The most common way to to specify the anchor are abbreviations of cardinal directions:value
description
‘C’
centered
‘SW’
lower left corner
‘S’
middle of bottom edge
‘SE’
lower right corner
etc.
See ~.Axes.set_anchor for further details.
- sharebool, default: False
If
True, apply the settings to all shared Axes.
See Also
- matplotlib.axes.Axes.set_adjustable
Set how the Axes adjusts to achieve the required aspect ratio.
- matplotlib.axes.Axes.set_anchor
Set the position in case of extra space.
- set_autoscale_on(b)
Set whether autoscaling is applied to each axis on the next draw or call to .Axes.autoscale_view.
Parameters
b : bool
- set_autoscalex_on(b)
Set whether the xaxis is autoscaled when drawing or by .Axes.autoscale_view.
Parameters
b : bool
- set_autoscaley_on(b)
Set whether the yaxis is autoscaled when drawing or by .Axes.autoscale_view.
Parameters
b : bool
- set_axes_locator(locator)
Set the Axes locator.
Parameters
locator : Callable[[Axes, Renderer], Bbox]
- set_axis_off()
Turn the x- and y-axis off.
This affects the axis lines, ticks, ticklabels, grid and axis labels.
- set_axis_on()
Turn the x- and y-axis on.
This affects the axis lines, ticks, ticklabels, grid and axis labels.
- set_axisbelow(b)
Set whether axis ticks and gridlines are above or below most artists.
This controls the zorder of the ticks and gridlines. For more information on the zorder see /gallery/misc/zorder_demo.
Parameters
- bbool or ‘line’
Possible values:
True (zorder = 0.5): Ticks and gridlines are below all Artists.
‘line’ (zorder = 1.5): Ticks and gridlines are above patches (e.g. rectangles, with default zorder = 1) but still below lines and markers (with their default zorder = 2).
False (zorder = 2.5): Ticks and gridlines are above patches and lines / markers.
See Also
get_axisbelow
- set_box_aspect(aspect=None)
Set the Axes box aspect, i.e. the ratio of height to width.
This defines the aspect of the Axes in figure space and is not to be confused with the data aspect (see ~.Axes.set_aspect).
Parameters
- aspectfloat or None
Changes the physical dimensions of the Axes, such that the ratio of the Axes height to the Axes width in physical units is equal to aspect. Defining a box aspect will change the adjustable property to ‘datalim’ (see ~.Axes.set_adjustable).
None will disable a fixed box aspect so that height and width of the Axes are chosen independently.
See Also
- matplotlib.axes.Axes.set_aspect
for a description of aspect handling.
- set_clip_on(b)
Set whether the artist uses clipping.
When False artists will be visible outside of the Axes which can lead to unexpected results.
Parameters
b : bool
- set_clip_path(path, transform=None)
Set the artist’s clip path.
Parameters
- path.Patch or .Path or .TransformedPath or None
The clip path. If given a .Path, transform must be provided as well. If None, a previously set clip path is removed.
- transform~matplotlib.transforms.Transform, optional
Only used if path is a .Path, in which case the given .Path is converted to a .TransformedPath using transform.
Notes
For efficiency, if path is a .Rectangle this method will set the clipping box to the corresponding rectangle and set the clipping path to
None.For technical reasons (support of ~.Artist.set), a tuple (path, transform) is also accepted as a single positional parameter.
- set_fc(color)
Alias for set_facecolor.
- set_in_layout(in_layout)
Set if artist is to be included in layout calculations, E.g. /tutorials/intermediate/constrainedlayout_guide, .Figure.tight_layout(), and
fig.savefig(fname, bbox_inches='tight').Parameters
in_layout : bool
- set_label(s)
Set a label that will be displayed in the legend.
Parameters
- sobject
s will be converted to a string by calling str.
- set_mouseover(mouseover)
Set whether this artist is queried for custom context information when the mouse cursor moves over it.
Parameters
mouseover : bool
See Also
get_cursor_data .ToolCursorPosition .NavigationToolbar2
Set whether the Axes responds to navigation toolbar commands.
Parameters
b : bool
Set the navigation toolbar button status.
Warning
This is not a user-API function.
- set_path_effects(path_effects)
Set the path effects.
Parameters
path_effects : .AbstractPathEffect
- set_picker(picker)
Define the picking behavior of the artist.
Parameters
- pickerNone or bool or float or callable
This can be one of the following:
None: Picking is disabled for this artist (default).
A boolean: If True then picking will be enabled and the artist will fire a pick event if the mouse event is over the artist.
A float: If picker is a number it is interpreted as an epsilon tolerance in points and the artist will fire off an event if its data is within epsilon of the mouse event. For some artists like lines and patch collections, the artist may provide additional data to the pick event that is generated, e.g., the indices of the data within epsilon of the pick event
A function: If picker is callable, it is a user supplied function which determines whether the artist is hit by the mouse event:
hit, props = picker(artist, mouseevent)
to determine the hit test. if the mouse event is over the artist, return hit=True and props is a dictionary of properties you want added to the PickEvent attributes.
- set_position(pos, which='both')
Set the Axes position.
Axes have two position attributes. The ‘original’ position is the position allocated for the Axes. The ‘active’ position is the position the Axes is actually drawn at. These positions are usually the same unless a fixed aspect is set to the Axes. See .Axes.set_aspect for details.
Parameters
- pos[left, bottom, width, height] or ~matplotlib.transforms.Bbox
The new position of the Axes in .Figure coordinates.
- which{‘both’, ‘active’, ‘original’}, default: ‘both’
Determines which position variables to change.
See Also
matplotlib.transforms.Bbox.from_bounds matplotlib.transforms.Bbox.from_extents
- set_prop_cycle(*args, **kwargs)
Set the property cycle of the Axes.
The property cycle controls the style properties such as color, marker and linestyle of future plot commands. The style properties of data already added to the Axes are not modified.
Call signatures:
set_prop_cycle(cycler)
set_prop_cycle(label=values[, label2=values2[, ...]])
set_prop_cycle(label, values)
Form 1 sets given ~cycler.Cycler object.
Form 2 creates a ~cycler.Cycler which cycles over one or more properties simultaneously and set it as the property cycle of the Axes. If multiple properties are given, their value lists must have the same length. This is just a shortcut for explicitly creating a cycler and passing it to the function, i.e. it’s short for
set_prop_cycle(cycler(label=values label2=values2, ...)).Form 3 creates a ~cycler.Cycler for a single property and set it as the property cycle of the Axes. This form exists for compatibility with the original cycler.cycler interface. Its use is discouraged in favor of the kwarg form, i.e.
set_prop_cycle(label=values).Parameters
- cyclerCycler
Set the given Cycler. None resets to the cycle defined by the current style.
- labelstr
The property key. Must be a valid .Artist property. For example, ‘color’ or ‘linestyle’. Aliases are allowed, such as ‘c’ for ‘color’ and ‘lw’ for ‘linewidth’.
- valuesiterable
Finite-length iterable of the property values. These values are validated and will raise a ValueError if invalid.
See Also
- matplotlib.rcsetup.cycler
Convenience function for creating validated cyclers for properties.
- cycler.cycler
The original function for creating unvalidated cyclers.
Examples
Setting the property cycle for a single property:
>>> ax.set_prop_cycle(color=['red', 'green', 'blue'])
Setting the property cycle for simultaneously cycling over multiple properties (e.g. red circle, green plus, blue cross):
>>> ax.set_prop_cycle(color=['red', 'green', 'blue'],
...                   marker=['o', '+', 'x'])
- set_rasterization_zorder(z)
Set the zorder threshold for rasterization for vector graphics output.
All artists with a zorder below the given value will be rasterized if they support rasterization.
This setting is ignored for pixel-based output.
See also /gallery/misc/rasterization_demo.
Parameters
- zfloat or None
The zorder below which artists are rasterized. If
Nonerasterization based on zorder is deactivated.
- set_rasterized(rasterized)
Force rasterized (bitmap) drawing for vector graphics output.
Rasterized drawing is not supported by all artists. If you try to enable this on an artist that does not support it, the command has no effect and a warning will be issued.
This setting is ignored for pixel-based output.
See also /gallery/misc/rasterization_demo.
Parameters
rasterized : bool
- set_sketch_params(scale=None, length=None, randomness=None)
Set the sketch parameters.
Parameters
- scalefloat, optional
The amplitude of the wiggle perpendicular to the source line, in pixels. If scale is None, or not provided, no sketch filter will be provided.
- lengthfloat, optional
The length of the wiggle along the line, in pixels (default 128.0)
- randomnessfloat, optional
The scale factor by which the length is shrunken or expanded (default 16.0)
The PGF backend uses this argument as an RNG seed and not as described above. Using the same seed yields the same random shape.
- set_snap(snap)
Set the snapping behavior.
Snapping aligns positions with the pixel grid, which results in clearer images. For example, if a black line of 1px width was defined at a position in between two pixels, the resulting image would contain the interpolated value of that line in the pixel grid, which would be a grey value on both adjacent pixel positions. In contrast, snapping will move the line to the nearest integer pixel value, so that the resulting image will really contain a 1px wide black line.
Snapping is currently only supported by the Agg and MacOSX backends.
Parameters
- snapbool or None
Possible values:
True: Snap vertices to the nearest pixel center.
False: Do not modify vertex positions.
None: (auto) If the path contains only rectilinear line segments, round to the nearest pixel center.
- set_title(label, fontdict=None, loc=None, pad=None, *, y=None, **kwargs)[source]
Set a title for the Axes.
Set one of the three available Axes titles. The available titles are positioned above the Axes in the center, flush with the left edge, and flush with the right edge.
Parameters
- labelstr
Text to use for the title
- fontdictdict
A dictionary controlling the appearance of the title text, the default fontdict is:
{'fontsize': rcParams['axes.titlesize'],
 'fontweight': rcParams['axes.titleweight'],
 'color': rcParams['axes.titlecolor'],
 'verticalalignment': 'baseline',
 'horizontalalignment': loc}
- loc{‘center’, ‘left’, ‘right’}, default: :rc:`axes.titlelocation`
Which title to set.
- yfloat, default: :rc:`axes.titley`
Vertical Axes location for the title (1.0 is the top). If None (the default) and :rc:`axes.titley` is also None, y is determined automatically to avoid decorators on the Axes.
- padfloat, default: :rc:`axes.titlepad`
The offset of the title from the top of the Axes, in points.
Returns
- .Text
The matplotlib text instance representing the title
Other Parameters
- **kwargs.Text properties
Other keyword arguments are text properties, see .Text for a list of valid text properties.
- set_xbound(lower=None, upper=None)
Set the lower and upper numerical bounds of the x-axis.
This method will honor axis inversion regardless of parameter order. It will not change the autoscaling setting (.get_autoscalex_on()).
Parameters
- lower, upperfloat or None
The lower and upper bounds. If None, the respective axis bound is not modified.
See Also
get_xbound get_xlim, set_xlim invert_xaxis, xaxis_inverted
- set_xlabel(xlabel, fontdict=None, labelpad=None, *, loc=None, **kwargs)
Set the label for the x-axis.
Parameters
- xlabelstr
The label text.
- labelpadfloat, default: :rc:`axes.labelpad`
Spacing in points from the Axes bounding box including ticks and tick labels. If None, the previous value is left as is.
- loc{‘left’, ‘center’, ‘right’}, default: :rc:`xaxis.labellocation`
The label position. This is a high-level alternative for passing parameters x and horizontalalignment.
Other Parameters
- **kwargs.Text properties
.Text properties control the appearance of the label.
See Also
text : Documents the properties supported by .Text.
- set_xlim(left=None, right=None, *, emit=True, auto=False, xmin=None, xmax=None)
Set the x-axis view limits.
Parameters
- leftfloat, optional
The left xlim in data coordinates. Passing None leaves the limit unchanged.
The left and right xlims may also be passed as the tuple (left, right) as the first positional argument (or as the left keyword argument).
- rightfloat, optional
The right xlim in data coordinates. Passing None leaves the limit unchanged.
- emitbool, default: True
Whether to notify observers of limit change.
- autobool or None, default: False
Whether to turn on autoscaling of the x-axis. True turns on, False turns off, None leaves unchanged.
- xmin, xmaxfloat, optional
They are equivalent to left and right respectively, and it is an error to pass both xmin and left or xmax and right.
Returns
- left, right(float, float)
The new x-axis limits in data coordinates.
See Also
get_xlim set_xbound, get_xbound invert_xaxis, xaxis_inverted
Notes
The left value may be greater than the right value, in which case the x-axis values will decrease from left to right.
Examples
>>> set_xlim(left, right)
>>> set_xlim((left, right))
>>> left, right = set_xlim(left, right)
One limit may be left unchanged.
>>> set_xlim(right=right_lim)
Limits may be passed in reverse order to flip the direction of the x-axis. For example, suppose x represents the number of years before present. The x-axis limits might be set like the following so 5000 years ago is on the left of the plot and the present is on the right.
>>> set_xlim(5000, 0)
- set_xmargin(m)
Set padding of X data limits prior to autoscaling.
m times the data interval will be added to each end of that interval before it is used in autoscaling. If m is negative, this will clip the data range instead of expanding it.
For example, if your data is in the range [0, 2], a margin of 0.1 will result in a range [-0.2, 2.2]; a margin of -0.1 will result in a range of [0.2, 1.8].
Parameters
m : float greater than -0.5
- set_xscale(value, **kwargs)
Set the xaxis’ scale.
Parameters
- value{“linear”, “log”, “symlog”, “logit”, …} or .ScaleBase
The axis scale type to apply.
- **kwargs
Different keyword arguments are accepted, depending on the scale. See the respective class keyword arguments:
matplotlib.scale.LinearScale
matplotlib.scale.LogScale
matplotlib.scale.SymmetricalLogScale
matplotlib.scale.LogitScale
matplotlib.scale.FuncScale
Notes
By default, Matplotlib supports the above mentioned scales. Additionally, custom scales may be registered using matplotlib.scale.register_scale. These scales can then also be used here.
- set_xticklabels(labels, *, fontdict=None, minor=False, **kwargs)
Set the xaxis’ labels with list of string labels.
Warning
This method should only be used after fixing the tick positions using .Axes.set_xticks. Otherwise, the labels may end up in unexpected positions.
Parameters
- labelslist of str
The label texts.
- fontdictdict, optional
A dictionary controlling the appearance of the ticklabels. The default fontdict is:
{'fontsize': rcParams['axes.titlesize'],
 'fontweight': rcParams['axes.titleweight'],
 'verticalalignment': 'baseline',
 'horizontalalignment': loc}
- minorbool, default: False
Whether to set the minor ticklabels rather than the major ones.
Returns
- list of .Text
The labels.
Other Parameters
**kwargs : ~.text.Text properties.
- set_xticks(ticks, labels=None, *, minor=False, **kwargs)
Set the xaxis’ tick locations and optionally labels.
If necessary, the view limits of the Axis are expanded so that all given ticks are visible.
Parameters
- tickslist of floats
List of tick locations. The axis .Locator is replaced by a ~.ticker.FixedLocator.
Some tick formatters will not label arbitrary tick positions; e.g. log formatters only label decade ticks by default. In such a case you can set a formatter explicitly on the axis using .Axis.set_major_formatter or provide formatted labels yourself.
- labelslist of str, optional
List of tick labels. If not set, the labels are generated with the axis tick .Formatter.
- minorbool, default: False
If
False, set the major ticks; ifTrue, the minor ticks.- **kwargs
.Text properties for the labels. These take effect only if you pass labels. In other cases, please use ~.Axes.tick_params.
Notes
The mandatory expansion of the view limits is an intentional design choice to prevent the surprise of a non-visible tick. If you need other limits, you should set the limits explicitly after setting the ticks.
- set_ybound(lower=None, upper=None)
Set the lower and upper numerical bounds of the y-axis.
This method will honor axis inversion regardless of parameter order. It will not change the autoscaling setting (.get_autoscaley_on()).
Parameters
- lower, upperfloat or None
The lower and upper bounds. If None, the respective axis bound is not modified.
See Also
get_ybound get_ylim, set_ylim invert_yaxis, yaxis_inverted
- set_ylabel(ylabel, fontdict=None, labelpad=None, *, loc=None, **kwargs)
Set the label for the y-axis.
Parameters
- ylabelstr
The label text.
- labelpadfloat, default: :rc:`axes.labelpad`
Spacing in points from the Axes bounding box including ticks and tick labels. If None, the previous value is left as is.
- loc{‘bottom’, ‘center’, ‘top’}, default: :rc:`yaxis.labellocation`
The label position. This is a high-level alternative for passing parameters y and horizontalalignment.
Other Parameters
- **kwargs.Text properties
.Text properties control the appearance of the label.
See Also
text : Documents the properties supported by .Text.
- set_ylim(bottom=None, top=None, *, emit=True, auto=False, ymin=None, ymax=None)
Set the y-axis view limits.
Parameters
- bottomfloat, optional
The bottom ylim in data coordinates. Passing None leaves the limit unchanged.
The bottom and top ylims may also be passed as the tuple (bottom, top) as the first positional argument (or as the bottom keyword argument).
- topfloat, optional
The top ylim in data coordinates. Passing None leaves the limit unchanged.
- emitbool, default: True
Whether to notify observers of limit change.
- autobool or None, default: False
Whether to turn on autoscaling of the y-axis. True turns on, False turns off, None leaves unchanged.
- ymin, ymaxfloat, optional
They are equivalent to bottom and top respectively, and it is an error to pass both ymin and bottom or ymax and top.
Returns
- bottom, top(float, float)
The new y-axis limits in data coordinates.
See Also
get_ylim set_ybound, get_ybound invert_yaxis, yaxis_inverted
Notes
The bottom value may be greater than the top value, in which case the y-axis values will decrease from bottom to top.
Examples
>>> set_ylim(bottom, top)
>>> set_ylim((bottom, top))
>>> bottom, top = set_ylim(bottom, top)
One limit may be left unchanged.
>>> set_ylim(top=top_lim)
Limits may be passed in reverse order to flip the direction of the y-axis. For example, suppose
yrepresents depth of the ocean in m. The y-axis limits might be set like the following so 5000 m depth is at the bottom of the plot and the surface, 0 m, is at the top.>>> set_ylim(5000, 0)
- set_ymargin(m)
Set padding of Y data limits prior to autoscaling.
m times the data interval will be added to each end of that interval before it is used in autoscaling. If m is negative, this will clip the data range instead of expanding it.
For example, if your data is in the range [0, 2], a margin of 0.1 will result in a range [-0.2, 2.2]; a margin of -0.1 will result in a range of [0.2, 1.8].
Parameters
m : float greater than -0.5
- set_yscale(value, **kwargs)
Set the yaxis’ scale.
Parameters
- value{“linear”, “log”, “symlog”, “logit”, …} or .ScaleBase
The axis scale type to apply.
- **kwargs
Different keyword arguments are accepted, depending on the scale. See the respective class keyword arguments:
matplotlib.scale.LinearScale
matplotlib.scale.LogScale
matplotlib.scale.SymmetricalLogScale
matplotlib.scale.LogitScale
matplotlib.scale.FuncScale
Notes
By default, Matplotlib supports the above mentioned scales. Additionally, custom scales may be registered using matplotlib.scale.register_scale. These scales can then also be used here.
- set_yticklabels(labels, *, fontdict=None, minor=False, **kwargs)
Set the yaxis’ labels with list of string labels.
Warning
This method should only be used after fixing the tick positions using .Axes.set_yticks. Otherwise, the labels may end up in unexpected positions.
Parameters
- labelslist of str
The label texts.
- fontdictdict, optional
A dictionary controlling the appearance of the ticklabels. The default fontdict is:
{'fontsize': rcParams['axes.titlesize'],
 'fontweight': rcParams['axes.titleweight'],
 'verticalalignment': 'baseline',
 'horizontalalignment': loc}
- minorbool, default: False
Whether to set the minor ticklabels rather than the major ones.
Returns
- list of .Text
The labels.
Other Parameters
**kwargs : ~.text.Text properties.
- set_yticks(ticks, labels=None, *, minor=False, **kwargs)
Set the yaxis’ tick locations and optionally labels.
If necessary, the view limits of the Axis are expanded so that all given ticks are visible.
Parameters
- tickslist of floats
List of tick locations. The axis .Locator is replaced by a ~.ticker.FixedLocator.
Some tick formatters will not label arbitrary tick positions; e.g. log formatters only label decade ticks by default. In such a case you can set a formatter explicitly on the axis using .Axis.set_major_formatter or provide formatted labels yourself.
- labelslist of str, optional
List of tick labels. If not set, the labels are generated with the axis tick .Formatter.
- minorbool, default: False
If
False, set the major ticks; ifTrue, the minor ticks.- **kwargs
.Text properties for the labels. These take effect only if you pass labels. In other cases, please use ~.Axes.tick_params.
Notes
The mandatory expansion of the view limits is an intentional design choice to prevent the surprise of a non-visible tick. If you need other limits, you should set the limits explicitly after setting the ticks.
- set_zorder(level)
Set the zorder for the artist. Artists with lower zorder values are drawn first.
Parameters
level : float
Share the x-axis with other.
This is equivalent to passing
sharex=otherwhen constructing the Axes, and cannot be used if the x-axis is already being shared with another Axes.
Share the y-axis with other.
This is equivalent to passing
sharey=otherwhen constructing the Axes, and cannot be used if the y-axis is already being shared with another Axes.
- specgram(x, NFFT=None, Fs=None, Fc=None, detrend=None, window=None, noverlap=None, cmap=None, xextent=None, pad_to=None, sides=None, scale_by_freq=None, mode=None, scale=None, vmin=None, vmax=None, *, data=None, **kwargs)[source]
Plot a spectrogram.
Compute and plot a spectrogram of data in x. Data are split into NFFT length segments and the spectrum of each section is computed. The windowing function window is applied to each segment, and the amount of overlap of each segment is specified with noverlap. The spectrogram is plotted as a colormap (using imshow).
Parameters
- x1-D array or sequence
Array or sequence containing the data.
- Fsfloat, default: 2
The sampling frequency (samples per time unit). It is used to calculate the Fourier frequencies, freqs, in cycles per time unit.
- windowcallable or ndarray, default: .window_hanning
A function or a vector of length NFFT. To create window vectors see .window_hanning, .window_none, numpy.blackman, numpy.hamming, numpy.bartlett, scipy.signal, scipy.signal.get_window, etc. If a function is passed as the argument, it must take a data segment as an argument and return the windowed version of the segment.
- sides{‘default’, ‘onesided’, ‘twosided’}, optional
Which sides of the spectrum to return. ‘default’ is one-sided for real data and two-sided for complex data. ‘onesided’ forces the return of a one-sided spectrum, while ‘twosided’ forces two-sided.
- pad_toint, optional
The number of points to which the data segment is padded when performing the FFT. This can be different from NFFT, which specifies the number of data points used. While not increasing the actual resolution of the spectrum (the minimum distance between resolvable peaks), this can give more points in the plot, allowing for more detail. This corresponds to the n parameter in the call to ~numpy.fft.fft. The default is None, which sets pad_to equal to NFFT
- NFFTint, default: 256
The number of data points used in each block for the FFT. A power 2 is most efficient. This should NOT be used to get zero padding, or the scaling of the result will be incorrect; use pad_to for this instead.
- detrend{‘none’, ‘mean’, ‘linear’} or callable, default: ‘none’
The function applied to each segment before fft-ing, designed to remove the mean or linear trend. Unlike in MATLAB, where the detrend parameter is a vector, in Matplotlib it is a function. The
mlabmodule defines .detrend_none, .detrend_mean, and .detrend_linear, but you can use a custom function as well. You can also use a string to choose one of the functions: ‘none’ calls .detrend_none. ‘mean’ calls .detrend_mean. ‘linear’ calls .detrend_linear.- scale_by_freqbool, default: True
Whether the resulting density values should be scaled by the scaling frequency, which gives density in units of 1/Hz. This allows for integration over the returned frequency values. The default is True for MATLAB compatibility.
- mode{‘default’, ‘psd’, ‘magnitude’, ‘angle’, ‘phase’}
What sort of spectrum to use. Default is ‘psd’, which takes the power spectral density. ‘magnitude’ returns the magnitude spectrum. ‘angle’ returns the phase spectrum without unwrapping. ‘phase’ returns the phase spectrum with unwrapping.
- noverlapint, default: 128
The number of points of overlap between blocks.
- scale{‘default’, ‘linear’, ‘dB’}
The scaling of the values in the spec. ‘linear’ is no scaling. ‘dB’ returns the values in dB scale. When mode is ‘psd’, this is dB power (10 * log10). Otherwise this is dB amplitude (20 * log10). ‘default’ is ‘dB’ if mode is ‘psd’ or ‘magnitude’ and ‘linear’ otherwise. This must be ‘linear’ if mode is ‘angle’ or ‘phase’.
- Fcint, default: 0
The center frequency of x, which offsets the x extents of the plot to reflect the frequency range used when a signal is acquired and then filtered and downsampled to baseband.
cmap : .Colormap, default: :rc:`image.cmap`
- xextentNone or (xmin, xmax)
The image extent along the x-axis. The default sets xmin to the left border of the first bin (spectrum column) and xmax to the right border of the last bin. Note that for noverlap>0 the width of the bins is smaller than those of the segments.
- dataindexable object, optional
If given, the following parameters also accept a string
s, which is interpreted asdata[s](unless this raises an exception):x
- **kwargs
Additional keyword arguments are passed on to ~.axes.Axes.imshow which makes the specgram image. The origin keyword argument is not supported.
Returns
- spectrum2D array
Columns are the periodograms of successive segments.
- freqs1-D array
The frequencies corresponding to the rows in spectrum.
- t1-D array
The times corresponding to midpoints of segments (i.e., the columns in spectrum).
- im.AxesImage
The image created by imshow containing the spectrogram.
See Also
- psd
Differs in the default overlap; in returning the mean of the segment periodograms; in not returning times; and in generating a line plot instead of colormap.
- magnitude_spectrum
A single spectrum, similar to having a single segment when mode is ‘magnitude’. Plots a line instead of a colormap.
- angle_spectrum
A single spectrum, similar to having a single segment when mode is ‘angle’. Plots a line instead of a colormap.
- phase_spectrum
A single spectrum, similar to having a single segment when mode is ‘phase’. Plots a line instead of a colormap.
Notes
The parameters detrend and scale_by_freq do only apply when mode is set to ‘psd’.
- spy(Z, precision=0, marker=None, markersize=None, aspect='equal', origin='upper', **kwargs)[source]
Plot the sparsity pattern of a 2D array.
This visualizes the non-zero values of the array.
Two plotting styles are available: image and marker. Both are available for full arrays, but only the marker style works for scipy.sparse.spmatrix instances.
Image style
If marker and markersize are None, ~.Axes.imshow is used. Any extra remaining keyword arguments are passed to this method.
Marker style
If Z is a scipy.sparse.spmatrix or marker or markersize are None, a .Line2D object will be returned with the value of marker determining the marker type, and any remaining keyword arguments passed to ~.Axes.plot.
Parameters
- Z(M, N) array-like
The array to be plotted.
- precisionfloat or ‘present’, default: 0
If precision is 0, any non-zero value will be plotted. Otherwise, values of \(|Z| > precision\) will be plotted.
For scipy.sparse.spmatrix instances, you can also pass ‘present’. In this case any value present in the array will be plotted, even if it is identically zero.
- aspect{‘equal’, ‘auto’, None} or float, default: ‘equal’
The aspect ratio of the Axes. This parameter is particularly relevant for images since it determines whether data pixels are square.
This parameter is a shortcut for explicitly calling .Axes.set_aspect. See there for further details.
‘equal’: Ensures an aspect ratio of 1. Pixels will be square.
‘auto’: The Axes is kept fixed and the aspect is adjusted so that the data fit in the Axes. In general, this will result in non-square pixels.
None: Use :rc:`image.aspect`.
- origin{‘upper’, ‘lower’}, default: :rc:`image.origin`
Place the [0, 0] index of the array in the upper left or lower left corner of the Axes. The convention ‘upper’ is typically used for matrices and images.
Returns
- ~matplotlib.image.AxesImage or .Line2D
The return type depends on the plotting style (see above).
Other Parameters
- **kwargs
The supported additional parameters depend on the plotting style.
For the image style, you can pass the following additional parameters of ~.Axes.imshow:
cmap
alpha
url
any .Artist properties (passed on to the .AxesImage)
For the marker style, you can pass any .Line2D property except for linestyle:
Properties: agg_filter: a filter function, which takes a (m, n, 3) float array and a dpi value, and returns a (m, n, 3) array and two offsets from the bottom left corner of the image alpha: scalar or None animated: bool antialiased or aa: bool clip_box: .Bbox clip_on: bool clip_path: Patch or (Path, Transform) or None color or c: color dash_capstyle: .CapStyle or {‘butt’, ‘projecting’, ‘round’} dash_joinstyle: .JoinStyle or {‘miter’, ‘round’, ‘bevel’} dashes: sequence of floats (on/off ink in points) or (None, None) data: (2, N) array or two 1D arrays drawstyle or ds: {‘default’, ‘steps’, ‘steps-pre’, ‘steps-mid’, ‘steps-post’}, default: ‘default’ figure: .Figure fillstyle: {‘full’, ‘left’, ‘right’, ‘bottom’, ‘top’, ‘none’} gapcolor: color or None gid: str in_layout: bool label: object linestyle or ls: {‘-’, ‘–’, ‘-.’, ‘:’, ‘’, (offset, on-off-seq), …} linewidth or lw: float marker: marker style string, ~.path.Path or ~.markers.MarkerStyle markeredgecolor or mec: color markeredgewidth or mew: float markerfacecolor or mfc: color markerfacecoloralt or mfcalt: color markersize or ms: float markevery: None or int or (int, int) or slice or list[int] or float or (float, float) or list[bool] mouseover: bool path_effects: .AbstractPathEffect picker: float or callable[[Artist, Event], tuple[bool, dict]] pickradius: unknown rasterized: bool sketch_params: (scale: float, length: float, randomness: float) snap: bool or None solid_capstyle: .CapStyle or {‘butt’, ‘projecting’, ‘round’} solid_joinstyle: .JoinStyle or {‘miter’, ‘round’, ‘bevel’} transform: unknown url: str visible: bool xdata: 1D array ydata: 1D array zorder: float
- stackplot(x, *args, labels=(), colors=None, baseline='zero', data=None, **kwargs)
Draw a stacked area plot.
Parameters
x : (N,) array-like
- y(M, N) array-like
The data is assumed to be unstacked. Each of the following calls is legal:
stackplot(x, y)           # where y has shape (M, N)
stackplot(x, y1, y2, y3)  # where y1, y2, y3, y4 have length N
- baseline{‘zero’, ‘sym’, ‘wiggle’, ‘weighted_wiggle’}
Method used to calculate the baseline:
'zero': Constant zero baseline, i.e. a simple stacked plot.'sym': Symmetric around zero and is sometimes called ‘ThemeRiver’.'wiggle': Minimizes the sum of the squared slopes.'weighted_wiggle': Does the same but weights to account for size of each layer. It is also called ‘Streamgraph’-layout. More details can be found at http://leebyron.com/streamgraph/.
- labelslist of str, optional
A sequence of labels to assign to each data series. If unspecified, then no labels will be applied to artists.
- colorslist of color, optional
A sequence of colors to be cycled through and used to color the stacked areas. The sequence need not be exactly the same length as the number of provided y, in which case the colors will repeat from the beginning.
If not specified, the colors from the Axes property cycle will be used.
- dataindexable object, optional
If given, all parameters also accept a string
s, which is interpreted asdata[s](unless this raises an exception).- **kwargs
All other keyword arguments are passed to .Axes.fill_between.
Returns
- list of .PolyCollection
A list of .PolyCollection instances, one for each element in the stacked area plot.
- stairs(values, edges=None, *, orientation='vertical', baseline=0, fill=False, data=None, **kwargs)[source]
A stepwise constant function as a line with bounding edges or a filled plot.
Parameters
- valuesarray-like
The step heights.
- edgesarray-like
The edge positions, with
len(edges) == len(vals) + 1, between which the curve takes on vals values.- orientation{‘vertical’, ‘horizontal’}, default: ‘vertical’
The direction of the steps. Vertical means that values are along the y-axis, and edges are along the x-axis.
- baselinefloat, array-like or None, default: 0
The bottom value of the bounding edges or when
fill=True, position of lower edge. If fill is True or an array is passed to baseline, a closed path is drawn.- fillbool, default: False
Whether the area under the step curve should be filled.
Returns
StepPatch : matplotlib.patches.StepPatch
Other Parameters
- dataindexable object, optional
If given, all parameters also accept a string
s, which is interpreted asdata[s](unless this raises an exception).- **kwargs
~matplotlib.patches.StepPatch properties
- property stale
Whether the artist is ‘stale’ and needs to be re-drawn for the output to match the internal state of the artist.
- start_pan(x, y, button)
Called when a pan operation has started.
Parameters
- x, yfloat
The mouse coordinates in display coords.
- button.MouseButton
The pressed mouse button.
Notes
This is intended to be overridden by new projection types.
- stem(*args, linefmt=None, markerfmt=None, basefmt=None, bottom=0, label=None, use_line_collection=<deprecated parameter>, orientation='vertical', data=None)[source]
Create a stem plot.
A stem plot draws lines perpendicular to a baseline at each location locs from the baseline to heads, and places a marker there. For vertical stem plots (the default), the locs are x positions, and the heads are y values. For horizontal stem plots, the locs are y positions, and the heads are x values.
Call signature:
stem([locs,] heads, linefmt=None, markerfmt=None, basefmt=None)
The locs-positions are optional. The formats may be provided either as positional or as keyword-arguments. Passing markerfmt and basefmt positionally is deprecated since Matplotlib 3.5.
Parameters
- locsarray-like, default: (0, 1, …, len(heads) - 1)
For vertical stem plots, the x-positions of the stems. For horizontal stem plots, the y-positions of the stems.
- headsarray-like
For vertical stem plots, the y-values of the stem heads. For horizontal stem plots, the x-values of the stem heads.
- linefmtstr, optional
A string defining the color and/or linestyle of the vertical lines:
Character
Line Style
'-'solid line
'--'dashed line
'-.'dash-dot line
':'dotted line
Default: ‘C0-’, i.e. solid line with the first color of the color cycle.
Note: Markers specified through this parameter (e.g. ‘x’) will be silently ignored (unless using
use_line_collection=False). Instead, markers should be specified using markerfmt.- markerfmtstr, optional
A string defining the color and/or shape of the markers at the stem heads. If the marker is not given, use the marker ‘o’, i.e. filled circles. If the color is not given, use the color from linefmt.
- basefmtstr, default: ‘C3-’ (‘C2-’ in classic mode)
A format string defining the properties of the baseline.
- orientationstr, default: ‘vertical’
If ‘vertical’, will produce a plot with stems oriented vertically, otherwise the stems will be oriented horizontally.
- bottomfloat, default: 0
The y/x-position of the baseline (depending on orientation).
- labelstr, default: None
The label to use for the stems in legends.
- use_line_collectionbool, default: True
Deprecated since 3.6
If
True, store and plot the stem lines as a ~.collections.LineCollection instead of individual lines, which significantly increases performance. IfFalse, defaults to the old behavior of using a list of .Line2D objects.- dataindexable object, optional
If given, all parameters also accept a string
s, which is interpreted asdata[s](unless this raises an exception).
Returns
- .StemContainer
The container may be treated like a tuple (markerline, stemlines, baseline)
Notes
See also
The MATLAB function stem which inspired this method.
- step(x, y, *args, where='pre', data=None, **kwargs)[source]
Make a step plot.
Call signatures:
step(x, y, [fmt], *, data=None, where='pre', **kwargs)
step(x, y, [fmt], x2, y2, [fmt2], ..., *, where='pre', **kwargs)
This is just a thin wrapper around .plot which changes some formatting options. Most of the concepts and parameters of plot can be used here as well.
Note
This method uses a standard plot with a step drawstyle: The x values are the reference positions and steps extend left/right/both directions depending on where.
For the common case where you know the values and edges of the steps, use ~.Axes.stairs instead.
Parameters
- xarray-like
1D sequence of x positions. It is assumed, but not checked, that it is uniformly increasing.
- yarray-like
1D sequence of y levels.
- fmtstr, optional
A format string, e.g. ‘g’ for a green line. See .plot for a more detailed description.
Note: While full format strings are accepted, it is recommended to only specify the color. Line styles are currently ignored (use the keyword argument linestyle instead). Markers are accepted and plotted on the given positions, however, this is a rarely needed feature for step plots.
- where{‘pre’, ‘post’, ‘mid’}, default: ‘pre’
Define where the steps should be placed:
‘pre’: The y value is continued constantly to the left from every x position, i.e. the interval
(x[i-1], x[i]]has the valuey[i].‘post’: The y value is continued constantly to the right from every x position, i.e. the interval
[x[i], x[i+1])has the valuey[i].‘mid’: Steps occur half-way between the x positions.
- dataindexable object, optional
An object with labelled data. If given, provide the label names to plot in x and y.
- **kwargs
Additional parameters are the same as those for .plot.
Returns
- list of .Line2D
Objects representing the plotted data.
- property sticky_edges
xandysticky edge lists for autoscaling.When performing autoscaling, if a data limit coincides with a value in the corresponding sticky_edges list, then no margin will be added–the view limit “sticks” to the edge. A typical use case is histograms, where one usually expects no margin on the bottom edge (0) of the histogram.
Moreover, margin expansion “bumps” against sticky edges and cannot cross them. For example, if the upper data limit is 1.0, the upper view limit computed by simple margin application is 1.2, but there is a sticky edge at 1.1, then the actual upper view limit will be 1.1.
This attribute cannot be assigned to; however, the
xandylists can be modified in place as needed.Examples
>>> artist.sticky_edges.x[:] = (xmin, xmax)
>>> artist.sticky_edges.y[:] = (ymin, ymax)
- streamplot(x, y, u, v, density=1, linewidth=None, color=None, cmap=None, norm=None, arrowsize=1, arrowstyle='-|>', minlength=0.1, transform=None, zorder=None, start_points=None, maxlength=4.0, integration_direction='both', broken_streamlines=True, *, data=None)
Draw streamlines of a vector flow.
Parameters
- x, y1D/2D arrays
Evenly spaced strictly increasing arrays to make a grid. If 2D, all rows of x must be equal and all columns of y must be equal; i.e., they must be as if generated by
np.meshgrid(x_1d, y_1d).- u, v2D arrays
x and y-velocities. The number of rows and columns must match the length of y and x, respectively.
- densityfloat or (float, float)
Controls the closeness of streamlines. When
density = 1, the domain is divided into a 30x30 grid. density linearly scales this grid. Each cell in the grid can have, at most, one traversing streamline. For different densities in each direction, use a tuple (density_x, density_y).- linewidthfloat or 2D array
The width of the stream lines. With a 2D array the line width can be varied across the grid. The array must have the same shape as u and v.
- colorcolor or 2D array
The streamline color. If given an array, its values are converted to colors using cmap and norm. The array must have the same shape as u and v.
- cmap, norm
Data normalization and colormapping parameters for color; only used if color is an array of floats. See ~.Axes.imshow for a detailed description.
- arrowsizefloat
Scaling factor for the arrow size.
- arrowstylestr
Arrow style specification. See ~matplotlib.patches.FancyArrowPatch.
- minlengthfloat
Minimum length of streamline in axes coordinates.
- start_pointsNx2 array
Coordinates of starting points for the streamlines in data coordinates (the same coordinates as the x and y arrays).
- zorderint
The zorder of the stream lines and arrows. Artists with lower zorder values are drawn first.
- maxlengthfloat
Maximum length of streamline in axes coordinates.
- integration_direction{‘forward’, ‘backward’, ‘both’}, default: ‘both’
Integrate the streamline in forward, backward or both directions.
- dataindexable object, optional
If given, the following parameters also accept a string
s, which is interpreted asdata[s](unless this raises an exception):x, y, u, v, start_points
- broken_streamlinesboolean, default: True
If False, forces streamlines to continue until they leave the plot domain. If True, they may be terminated if they come too close to another streamline.
Returns
- StreamplotSet
Container object with attributes
lines: .LineCollection of streamlinesarrows: .PatchCollection containing .FancyArrowPatch objects representing the arrows half-way along stream lines.
This container will probably change in the future to allow changes to the colormap, alpha, etc. for both lines and arrows, but these changes should be backward compatible.
- table(cellText=None, cellColours=None, cellLoc='right', colWidths=None, rowLabels=None, rowColours=None, rowLoc='left', colLabels=None, colColours=None, colLoc='center', loc='bottom', bbox=None, edges='closed', **kwargs)
Add a table to an ~.axes.Axes.
At least one of cellText or cellColours must be specified. These parameters must be 2D lists, in which the outer lists define the rows and the inner list define the column values per row. Each row must have the same number of elements.
The table can optionally have row and column headers, which are configured using rowLabels, rowColours, rowLoc and colLabels, colColours, colLoc respectively.
For finer grained control over tables, use the .Table class and add it to the axes with .Axes.add_table.
Parameters
- cellText2D list of str, optional
The texts to place into the table cells.
Note: Line breaks in the strings are currently not accounted for and will result in the text exceeding the cell boundaries.
- cellColours2D list of colors, optional
The background colors of the cells.
- cellLoc{‘left’, ‘center’, ‘right’}, default: ‘right’
The alignment of the text within the cells.
- colWidthslist of float, optional
The column widths in units of the axes. If not given, all columns will have a width of 1 / ncols.
- rowLabelslist of str, optional
The text of the row header cells.
- rowColourslist of colors, optional
The colors of the row header cells.
- rowLoc{‘left’, ‘center’, ‘right’}, default: ‘left’
The text alignment of the row header cells.
- colLabelslist of str, optional
The text of the column header cells.
- colColourslist of colors, optional
The colors of the column header cells.
- colLoc{‘left’, ‘center’, ‘right’}, default: ‘left’
The text alignment of the column header cells.
- locstr, optional
The position of the cell with respect to ax. This must be one of the ~.Table.codes.
- bbox.Bbox, optional
A bounding box to draw the table into. If this is not None, this overrides loc.
- edgessubstring of ‘BRTL’ or {‘open’, ‘closed’, ‘horizontal’, ‘vertical’}
The cell edges to be drawn with a line. See also ~.Cell.visible_edges.
Returns
- ~matplotlib.table.Table
The created table.
Other Parameters
- **kwargs
.Table properties.
- Properties:
agg_filter: a filter function, which takes a (m, n, 3) float array and a dpi value, and returns a (m, n, 3) array and two offsets from the bottom left corner of the image alpha: scalar or None animated: bool clip_box: .Bbox clip_on: bool clip_path: Patch or (Path, Transform) or None figure: .Figure fontsize: float gid: str in_layout: bool label: object mouseover: bool path_effects: .AbstractPathEffect picker: None or bool or float or callable rasterized: bool sketch_params: (scale: float, length: float, randomness: float) snap: bool or None transform: .Transform url: str visible: bool zorder: float
- text(x, y, s, fontdict=None, **kwargs)[source]
Add text to the Axes.
Add the text s to the Axes at location x, y in data coordinates.
Parameters
- x, yfloat
The position to place the text. By default, this is in data coordinates. The coordinate system can be changed using the transform parameter.
- sstr
The text.
- fontdictdict, default: None
A dictionary to override the default text properties. If fontdict is None, the defaults are determined by .rcParams.
Returns
- .Text
The created .Text instance.
Other Parameters
- **kwargs~matplotlib.text.Text properties.
Other miscellaneous text parameters.
Properties: agg_filter: a filter function, which takes a (m, n, 3) float array and a dpi value, and returns a (m, n, 3) array and two offsets from the bottom left corner of the image alpha: scalar or None animated: bool backgroundcolor: color bbox: dict with properties for .patches.FancyBboxPatch clip_box: unknown clip_on: unknown clip_path: unknown color or c: color figure: .Figure fontfamily or family: {FONTNAME, ‘serif’, ‘sans-serif’, ‘cursive’, ‘fantasy’, ‘monospace’} fontproperties or font or font_properties: .font_manager.FontProperties or str or pathlib.Path fontsize or size: float or {‘xx-small’, ‘x-small’, ‘small’, ‘medium’, ‘large’, ‘x-large’, ‘xx-large’} fontstretch or stretch: {a numeric value in range 0-1000, ‘ultra-condensed’, ‘extra-condensed’, ‘condensed’, ‘semi-condensed’, ‘normal’, ‘semi-expanded’, ‘expanded’, ‘extra-expanded’, ‘ultra-expanded’} fontstyle or style: {‘normal’, ‘italic’, ‘oblique’} fontvariant or variant: {‘normal’, ‘small-caps’} fontweight or weight: {a numeric value in range 0-1000, ‘ultralight’, ‘light’, ‘normal’, ‘regular’, ‘book’, ‘medium’, ‘roman’, ‘semibold’, ‘demibold’, ‘demi’, ‘bold’, ‘heavy’, ‘extra bold’, ‘black’} gid: str horizontalalignment or ha: {‘left’, ‘center’, ‘right’} in_layout: bool label: object linespacing: float (multiple of font size) math_fontfamily: str mouseover: bool multialignment or ma: {‘left’, ‘right’, ‘center’} parse_math: bool path_effects: .AbstractPathEffect picker: None or bool or float or callable position: (float, float) rasterized: bool rotation: float or {‘vertical’, ‘horizontal’} rotation_mode: {None, ‘default’, ‘anchor’} sketch_params: (scale: float, length: float, randomness: float) snap: bool or None text: object transform: .Transform transform_rotates_text: bool url: str usetex: bool or None verticalalignment or va: {‘bottom’, ‘baseline’, ‘center’, ‘center_baseline’, ‘top’} visible: bool wrap: bool x: float y: float zorder: float
Examples
Individual keyword arguments can be used to override any given parameter:
>>> text(x, y, s, fontsize=12)
The default transform specifies that text is in data coords, alternatively, you can specify text in axis coords ((0, 0) is lower-left and (1, 1) is upper-right). The example below places text in the center of the Axes:
>>> text(0.5, 0.5, 'matplotlib', horizontalalignment='center',
...      verticalalignment='center', transform=ax.transAxes)
You can put a rectangular box around the text instance (e.g., to set a background color) by using the keyword bbox. bbox is a dictionary of ~matplotlib.patches.Rectangle properties. For example:
>>> text(x, y, s, bbox=dict(facecolor='red', alpha=0.5))
- tick_params(axis='both', **kwargs)
Change the appearance of ticks, tick labels, and gridlines.
Tick properties that are not explicitly set using the keyword arguments remain unchanged unless reset is True.
Parameters
- axis{‘x’, ‘y’, ‘both’}, default: ‘both’
The axis to which the parameters are applied.
- which{‘major’, ‘minor’, ‘both’}, default: ‘major’
The group of ticks to which the parameters are applied.
- resetbool, default: False
Whether to reset the ticks to defaults before updating them.
Other Parameters
- direction{‘in’, ‘out’, ‘inout’}
Puts ticks inside the Axes, outside the Axes, or both.
- lengthfloat
Tick length in points.
- widthfloat
Tick width in points.
- colorcolor
Tick color.
- padfloat
Distance in points between tick and label.
- labelsizefloat or str
Tick label font size in points or as a string (e.g., ‘large’).
- labelcolorcolor
Tick label color.
- colorscolor
Tick color and label color.
- zorderfloat
Tick and label zorder.
- bottom, top, left, rightbool
Whether to draw the respective ticks.
- labelbottom, labeltop, labelleft, labelrightbool
Whether to draw the respective tick labels.
- labelrotationfloat
Tick label rotation
- grid_colorcolor
Gridline color.
- grid_alphafloat
Transparency of gridlines: 0 (transparent) to 1 (opaque).
- grid_linewidthfloat
Width of gridlines in points.
- grid_linestylestr
Any valid .Line2D line style spec.
Examples
ax.tick_params(direction='out', length=6, width=2, colors='r',
               grid_color='r', grid_alpha=0.5)
This will make all major ticks be red, pointing out of the box, and with dimensions 6 points by 2 points. Tick labels will also be red. Gridlines will be red and translucent.
- ticklabel_format(*, axis='both', style='', scilimits=None, useOffset=None, useLocale=None, useMathText=None)
Configure the .ScalarFormatter used by default for linear Axes.
If a parameter is not set, the corresponding property of the formatter is left unchanged.
Parameters
- axis{‘x’, ‘y’, ‘both’}, default: ‘both’
The axis to configure. Only major ticks are affected.
- style{‘sci’, ‘scientific’, ‘plain’}
Whether to use scientific notation. The formatter default is to use scientific notation.
- scilimitspair of ints (m, n)
Scientific notation is used only for numbers outside the range 10m to 10n (and only if the formatter is configured to use scientific notation at all). Use (0, 0) to include all numbers. Use (m, m) where m != 0 to fix the order of magnitude to 10m. The formatter default is :rc:`axes.formatter.limits`.
- useOffsetbool or float
If True, the offset is calculated as needed. If False, no offset is used. If a numeric value, it sets the offset. The formatter default is :rc:`axes.formatter.useoffset`.
- useLocalebool
Whether to format the number using the current locale or using the C (English) locale. This affects e.g. the decimal separator. The formatter default is :rc:`axes.formatter.use_locale`.
- useMathTextbool
Render the offset and scientific notation in mathtext. The formatter default is :rc:`axes.formatter.use_mathtext`.
Raises
- AttributeError
If the current formatter is not a .ScalarFormatter.
- tricontour(*args, **kwargs)
Draw contour lines on an unstructured triangular grid.
Call signatures:
tricontour(triangulation, z, [levels], ...)
tricontour(x, y, z, [levels], *, [triangles=triangles], [mask=mask], ...)
The triangular grid can be specified either by passing a .Triangulation object as the first parameter, or by passing the points x, y and optionally the triangles and a mask. See .Triangulation for an explanation of these parameters. If neither of triangulation or triangles are given, the triangulation is calculated on the fly.
It is possible to pass triangles positionally, i.e.
tricontour(x, y, triangles, z, ...). However, this is discouraged. For more clarity, pass triangles via keyword argument.Parameters
- triangulation.Triangulation, optional
An already created triangular grid.
- x, y, triangles, mask
Parameters defining the triangular grid. See .Triangulation. This is mutually exclusive with specifying triangulation.
- zarray-like
The height values over which the contour is drawn. Color-mapping is controlled by cmap, norm, vmin, and vmax.
- levelsint or array-like, optional
Determines the number and positions of the contour lines / regions.
If an int n, use ~matplotlib.ticker.MaxNLocator, which tries to automatically choose no more than n+1 “nice” contour levels between between minimum and maximum numeric values of Z.
If array-like, draw contour lines at the specified levels. The values must be in increasing order.
Returns
~matplotlib.tri.TriContourSet
Other Parameters
- colorscolor string or sequence of colors, optional
The colors of the levels, i.e., the contour lines.
The sequence is cycled for the levels in ascending order. If the sequence is shorter than the number of levels, it is repeated.
As a shortcut, single color strings may be used in place of one-element lists, i.e.
'red'instead of['red']to color all levels with the same color. This shortcut does only work for color strings, not for other ways of specifying colors.By default (value None), the colormap specified by cmap will be used.
- alphafloat, default: 1
The alpha blending value, between 0 (transparent) and 1 (opaque).
- cmapstr or ~matplotlib.colors.Colormap, default: :rc:`image.cmap`
The Colormap instance or registered colormap name used to map scalar data to colors.
This parameter is ignored if colors is set.
- normstr or ~matplotlib.colors.Normalize, optional
The normalization method used to scale scalar data to the [0, 1] range before mapping to colors using cmap. By default, a linear scaling is used, mapping the lowest value to 0 and the highest to 1.
If given, this can be one of the following:
An instance of .Normalize or one of its subclasses (see /tutorials/colors/colormapnorms).
A scale name, i.e. one of “linear”, “log”, “symlog”, “logit”, etc. For a list of available scales, call matplotlib.scale.get_scale_names(). In that case, a suitable .Normalize subclass is dynamically generated and instantiated.
This parameter is ignored if colors is set.
- vmin, vmaxfloat, optional
When using scalar data and no explicit norm, vmin and vmax define the data range that the colormap covers. By default, the colormap covers the complete value range of the supplied data. It is an error to use vmin/vmax when a norm instance is given (but using a str norm name together with vmin/vmax is acceptable).
If vmin or vmax are not given, the default color scaling is based on levels.
This parameter is ignored if colors is set.
- origin{None, ‘upper’, ‘lower’, ‘image’}, default: None
Determines the orientation and exact position of z by specifying the position of
z[0, 0]. This is only relevant, if X, Y are not given.None:
z[0, 0]is at X=0, Y=0 in the lower left corner.‘lower’:
z[0, 0]is at X=0.5, Y=0.5 in the lower left corner.‘upper’:
z[0, 0]is at X=N+0.5, Y=0.5 in the upper left corner.‘image’: Use the value from :rc:`image.origin`.
- extent(x0, x1, y0, y1), optional
If origin is not None, then extent is interpreted as in .imshow: it gives the outer pixel boundaries. In this case, the position of z[0, 0] is the center of the pixel, not a corner. If origin is None, then (x0, y0) is the position of z[0, 0], and (x1, y1) is the position of z[-1, -1].
This argument is ignored if X and Y are specified in the call to contour.
- locatorticker.Locator subclass, optional
The locator is used to determine the contour levels if they are not given explicitly via levels. Defaults to ~.ticker.MaxNLocator.
- extend{‘neither’, ‘both’, ‘min’, ‘max’}, default: ‘neither’
Determines the
tricontour-coloring of values that are outside the levels range.If ‘neither’, values outside the levels range are not colored. If ‘min’, ‘max’ or ‘both’, color the values below, above or below and above the levels range.
Values below
min(levels)and abovemax(levels)are mapped to the under/over values of the .Colormap. Note that most colormaps do not have dedicated colors for these by default, so that the over and under values are the edge values of the colormap. You may want to set these values explicitly using .Colormap.set_under and .Colormap.set_over.Note
An existing .TriContourSet does not get notified if properties of its colormap are changed. Therefore, an explicit call to .ContourSet.changed() is needed after modifying the colormap. The explicit call can be left out, if a colorbar is assigned to the .TriContourSet because it internally calls .ContourSet.changed().
- xunits, yunitsregistered units, optional
Override axis units by specifying an instance of a
matplotlib.units.ConversionInterface.- antialiasedbool, optional
Enable antialiasing, overriding the defaults. For filled contours, the default is True. For line contours, it is taken from :rc:`lines.antialiased`.
- linewidthsfloat or array-like, default: :rc:`contour.linewidth`
The line width of the contour lines.
If a number, all levels will be plotted with this linewidth.
If a sequence, the levels in ascending order will be plotted with the linewidths in the order specified.
If None, this falls back to :rc:`lines.linewidth`.
- linestyles{None, ‘solid’, ‘dashed’, ‘dashdot’, ‘dotted’}, optional
If linestyles is None, the default is ‘solid’ unless the lines are monochrome. In that case, negative contours will take their linestyle from :rc:`contour.negative_linestyle` setting.
linestyles can also be an iterable of the above strings specifying a set of linestyles to be used. If this iterable is shorter than the number of contour levels it will be repeated as necessary.
- tricontourf(*args, **kwargs)
Draw contour regions on an unstructured triangular grid.
Call signatures:
tricontourf(triangulation, z, [levels], ...)
tricontourf(x, y, z, [levels], *, [triangles=triangles], [mask=mask], ...)
The triangular grid can be specified either by passing a .Triangulation object as the first parameter, or by passing the points x, y and optionally the triangles and a mask. See .Triangulation for an explanation of these parameters. If neither of triangulation or triangles are given, the triangulation is calculated on the fly.
It is possible to pass triangles positionally, i.e.
tricontourf(x, y, triangles, z, ...). However, this is discouraged. For more clarity, pass triangles via keyword argument.Parameters
- triangulation.Triangulation, optional
An already created triangular grid.
- x, y, triangles, mask
Parameters defining the triangular grid. See .Triangulation. This is mutually exclusive with specifying triangulation.
- zarray-like
The height values over which the contour is drawn. Color-mapping is controlled by cmap, norm, vmin, and vmax.
- levelsint or array-like, optional
Determines the number and positions of the contour lines / regions.
If an int n, use ~matplotlib.ticker.MaxNLocator, which tries to automatically choose no more than n+1 “nice” contour levels between between minimum and maximum numeric values of Z.
If array-like, draw contour lines at the specified levels. The values must be in increasing order.
Returns
~matplotlib.tri.TriContourSet
Other Parameters
- colorscolor string or sequence of colors, optional
The colors of the levels, i.e., the contour regions.
The sequence is cycled for the levels in ascending order. If the sequence is shorter than the number of levels, it is repeated.
As a shortcut, single color strings may be used in place of one-element lists, i.e.
'red'instead of['red']to color all levels with the same color. This shortcut does only work for color strings, not for other ways of specifying colors.By default (value None), the colormap specified by cmap will be used.
- alphafloat, default: 1
The alpha blending value, between 0 (transparent) and 1 (opaque).
- cmapstr or ~matplotlib.colors.Colormap, default: :rc:`image.cmap`
The Colormap instance or registered colormap name used to map scalar data to colors.
This parameter is ignored if colors is set.
- normstr or ~matplotlib.colors.Normalize, optional
The normalization method used to scale scalar data to the [0, 1] range before mapping to colors using cmap. By default, a linear scaling is used, mapping the lowest value to 0 and the highest to 1.
If given, this can be one of the following:
An instance of .Normalize or one of its subclasses (see /tutorials/colors/colormapnorms).
A scale name, i.e. one of “linear”, “log”, “symlog”, “logit”, etc. For a list of available scales, call matplotlib.scale.get_scale_names(). In that case, a suitable .Normalize subclass is dynamically generated and instantiated.
This parameter is ignored if colors is set.
- vmin, vmaxfloat, optional
When using scalar data and no explicit norm, vmin and vmax define the data range that the colormap covers. By default, the colormap covers the complete value range of the supplied data. It is an error to use vmin/vmax when a norm instance is given (but using a str norm name together with vmin/vmax is acceptable).
If vmin or vmax are not given, the default color scaling is based on levels.
This parameter is ignored if colors is set.
- origin{None, ‘upper’, ‘lower’, ‘image’}, default: None
Determines the orientation and exact position of z by specifying the position of
z[0, 0]. This is only relevant, if X, Y are not given.None:
z[0, 0]is at X=0, Y=0 in the lower left corner.‘lower’:
z[0, 0]is at X=0.5, Y=0.5 in the lower left corner.‘upper’:
z[0, 0]is at X=N+0.5, Y=0.5 in the upper left corner.‘image’: Use the value from :rc:`image.origin`.
- extent(x0, x1, y0, y1), optional
If origin is not None, then extent is interpreted as in .imshow: it gives the outer pixel boundaries. In this case, the position of z[0, 0] is the center of the pixel, not a corner. If origin is None, then (x0, y0) is the position of z[0, 0], and (x1, y1) is the position of z[-1, -1].
This argument is ignored if X and Y are specified in the call to contour.
- locatorticker.Locator subclass, optional
The locator is used to determine the contour levels if they are not given explicitly via levels. Defaults to ~.ticker.MaxNLocator.
- extend{‘neither’, ‘both’, ‘min’, ‘max’}, default: ‘neither’
Determines the
tricontourf-coloring of values that are outside the levels range.If ‘neither’, values outside the levels range are not colored. If ‘min’, ‘max’ or ‘both’, color the values below, above or below and above the levels range.
Values below
min(levels)and abovemax(levels)are mapped to the under/over values of the .Colormap. Note that most colormaps do not have dedicated colors for these by default, so that the over and under values are the edge values of the colormap. You may want to set these values explicitly using .Colormap.set_under and .Colormap.set_over.Note
An existing .TriContourSet does not get notified if properties of its colormap are changed. Therefore, an explicit call to .ContourSet.changed() is needed after modifying the colormap. The explicit call can be left out, if a colorbar is assigned to the .TriContourSet because it internally calls .ContourSet.changed().
- xunits, yunitsregistered units, optional
Override axis units by specifying an instance of a
matplotlib.units.ConversionInterface.- antialiasedbool, optional
Enable antialiasing, overriding the defaults. For filled contours, the default is True. For line contours, it is taken from :rc:`lines.antialiased`.
- hatcheslist[str], optional
A list of cross hatch patterns to use on the filled areas. If None, no hatching will be added to the contour. Hatching is supported in the PostScript, PDF, SVG and Agg backends only.
Notes
.tricontourf fills intervals that are closed at the top; that is, for boundaries z1 and z2, the filled region is:
z1 < Z <= z2
except for the lowest interval, which is closed on both sides (i.e. it includes the lowest value).
- tripcolor(*args, alpha=1.0, norm=None, cmap=None, vmin=None, vmax=None, shading='flat', facecolors=None, **kwargs)
Create a pseudocolor plot of an unstructured triangular grid.
Call signatures:
tripcolor(triangulation, c, *, ...)
tripcolor(x, y, c, *, [triangles=triangles], [mask=mask], ...)
The triangular grid can be specified either by passing a .Triangulation object as the first parameter, or by passing the points x, y and optionally the triangles and a mask. See .Triangulation for an explanation of these parameters.
It is possible to pass the triangles positionally, i.e.
tripcolor(x, y, triangles, c, ...). However, this is discouraged. For more clarity, pass triangles via keyword argument.If neither of triangulation or triangles are given, the triangulation is calculated on the fly. In this case, it does not make sense to provide colors at the triangle faces via c or facecolors because there are multiple possible triangulations for a group of points and you don’t know which triangles will be constructed.
Parameters
- triangulation.Triangulation
An already created triangular grid.
- x, y, triangles, mask
Parameters defining the triangular grid. See .Triangulation. This is mutually exclusive with specifying triangulation.
- carray-like
The color values, either for the points or for the triangles. Which one is automatically inferred from the length of c, i.e. does it match the number of points or the number of triangles. If there are the same number of points and triangles in the triangulation it is assumed that color values are defined at points; to force the use of color values at triangles use the keyword argument
facecolors=cinstead of justc. This parameter is position-only.- facecolorsarray-like, optional
Can be used alternatively to c to specify colors at the triangle faces. This parameter takes precedence over c.
- shading{‘flat’, ‘gouraud’}, default: ‘flat’
If ‘flat’ and the color values c are defined at points, the color values used for each triangle are from the mean c of the triangle’s three points. If shading is ‘gouraud’ then color values must be defined at points.
- other_parameters
All other parameters are the same as for ~.Axes.pcolor.
- triplot(*args, **kwargs)
Draw an unstructured triangular grid as lines and/or markers.
Call signatures:
triplot(triangulation, ...)
triplot(x, y, [triangles], *, [mask=mask], ...)
The triangular grid can be specified either by passing a .Triangulation object as the first parameter, or by passing the points x, y and optionally the triangles and a mask. If neither of triangulation or triangles are given, the triangulation is calculated on the fly.
Parameters
- triangulation.Triangulation
An already created triangular grid.
- x, y, triangles, mask
Parameters defining the triangular grid. See .Triangulation. This is mutually exclusive with specifying triangulation.
- other_parameters
All other args and kwargs are forwarded to ~.Axes.plot.
Returns
- lines~matplotlib.lines.Line2D
The drawn triangles edges.
- markers~matplotlib.lines.Line2D
The drawn marker nodes.
- twinx()
Create a twin Axes sharing the xaxis.
Create a new Axes with an invisible x-axis and an independent y-axis positioned opposite to the original one (i.e. at right). The x-axis autoscale setting will be inherited from the original Axes. To ensure that the tick marks of both y-axes align, see ~matplotlib.ticker.LinearLocator.
Returns
- Axes
The newly created Axes instance
Notes
For those who are ‘picking’ artists while using twinx, pick events are only called for the artists in the top-most Axes.
- twiny()
Create a twin Axes sharing the yaxis.
Create a new Axes with an invisible y-axis and an independent x-axis positioned opposite to the original one (i.e. at top). The y-axis autoscale setting will be inherited from the original Axes. To ensure that the tick marks of both x-axes align, see ~matplotlib.ticker.LinearLocator.
Returns
- Axes
The newly created Axes instance
Notes
For those who are ‘picking’ artists while using twiny, pick events are only called for the artists in the top-most Axes.
- update_datalim(xys, updatex=True, updatey=True)
Extend the ~.Axes.dataLim Bbox to include the given points.
If no data is set currently, the Bbox will ignore its limits and set the bound to be the bounds of the xydata (xys). Otherwise, it will compute the bounds of the union of its current data and the data in xys.
Parameters
- xys2D array-like
The points to include in the data limits Bbox. This can be either a list of (x, y) tuples or a Nx2 array.
- updatex, updateybool, default: True
Whether to update the x/y limits.
- update_from(other)
Copy properties from other to self.
- property use_sticky_edges
When autoscaling, whether to obey all Artist.sticky_edges.
Default is
True.Setting this to
Falseensures that the specified margins will be applied, even if the plot includes an image, for example, which would otherwise force a view limit to coincide with its data limit.The changing this property does not change the plot until autoscale or autoscale_view is called.
- violin(vpstats, positions=None, vert=True, widths=0.5, showmeans=False, showextrema=True, showmedians=False)[source]
Drawing function for violin plots.
Draw a violin plot for each column of vpstats. Each filled area extends to represent the entire data range, with optional lines at the mean, the median, the minimum, the maximum, and the quantiles values.
Parameters
- vpstatslist of dicts
A list of dictionaries containing stats for each violin plot. Required keys are:
coords: A list of scalars containing the coordinates that the violin’s kernel density estimate were evaluated at.vals: A list of scalars containing the values of the kernel density estimate at each of the coordinates given in coords.mean: The mean value for this violin’s dataset.median: The median value for this violin’s dataset.min: The minimum value for this violin’s dataset.max: The maximum value for this violin’s dataset.
Optional keys are:
quantiles: A list of scalars containing the quantile values for this violin’s dataset.
- positionsarray-like, default: [1, 2, …, n]
The positions of the violins. The ticks and limits are automatically set to match the positions.
- vertbool, default: True.
If true, plots the violins vertically. Otherwise, plots the violins horizontally.
- widthsarray-like, default: 0.5
Either a scalar or a vector that sets the maximal width of each violin. The default is 0.5, which uses about half of the available horizontal space.
- showmeansbool, default: False
If true, will toggle rendering of the means.
- showextremabool, default: True
If true, will toggle rendering of the extrema.
- showmediansbool, default: False
If true, will toggle rendering of the medians.
Returns
- dict
A dictionary mapping each component of the violinplot to a list of the corresponding collection instances created. The dictionary has the following keys:
bodies: A list of the ~.collections.PolyCollection instances containing the filled area of each violin.cmeans: A ~.collections.LineCollection instance that marks the mean values of each of the violin’s distribution.cmins: A ~.collections.LineCollection instance that marks the bottom of each violin’s distribution.cmaxes: A ~.collections.LineCollection instance that marks the top of each violin’s distribution.cbars: A ~.collections.LineCollection instance that marks the centers of each violin’s distribution.cmedians: A ~.collections.LineCollection instance that marks the median values of each of the violin’s distribution.cquantiles: A ~.collections.LineCollection instance created to identify the quantiles values of each of the violin’s distribution.
- violinplot(dataset, positions=None, vert=True, widths=0.5, showmeans=False, showextrema=True, showmedians=False, quantiles=None, points=100, bw_method=None, *, data=None)[source]
Make a violin plot.
Make a violin plot for each column of dataset or each vector in sequence dataset. Each filled area extends to represent the entire data range, with optional lines at the mean, the median, the minimum, the maximum, and user-specified quantiles.
Parameters
- datasetArray or a sequence of vectors.
The input data.
- positionsarray-like, default: [1, 2, …, n]
The positions of the violins. The ticks and limits are automatically set to match the positions.
- vertbool, default: True.
If true, creates a vertical violin plot. Otherwise, creates a horizontal violin plot.
- widthsarray-like, default: 0.5
Either a scalar or a vector that sets the maximal width of each violin. The default is 0.5, which uses about half of the available horizontal space.
- showmeansbool, default: False
If True, will toggle rendering of the means.
- showextremabool, default: True
If True, will toggle rendering of the extrema.
- showmediansbool, default: False
If True, will toggle rendering of the medians.
- quantilesarray-like, default: None
If not None, set a list of floats in interval [0, 1] for each violin, which stands for the quantiles that will be rendered for that violin.
- pointsint, default: 100
Defines the number of points to evaluate each of the gaussian kernel density estimations at.
- bw_methodstr, scalar or callable, optional
The method used to calculate the estimator bandwidth. This can be ‘scott’, ‘silverman’, a scalar constant or a callable. If a scalar, this will be used directly as kde.factor. If a callable, it should take a matplotlib.mlab.GaussianKDE instance as its only parameter and return a scalar. If None (default), ‘scott’ is used.
- dataindexable object, optional
If given, the following parameters also accept a string
s, which is interpreted asdata[s](unless this raises an exception):dataset
Returns
- dict
A dictionary mapping each component of the violinplot to a list of the corresponding collection instances created. The dictionary has the following keys:
bodies: A list of the ~.collections.PolyCollection instances containing the filled area of each violin.cmeans: A ~.collections.LineCollection instance that marks the mean values of each of the violin’s distribution.cmins: A ~.collections.LineCollection instance that marks the bottom of each violin’s distribution.cmaxes: A ~.collections.LineCollection instance that marks the top of each violin’s distribution.cbars: A ~.collections.LineCollection instance that marks the centers of each violin’s distribution.cmedians: A ~.collections.LineCollection instance that marks the median values of each of the violin’s distribution.cquantiles: A ~.collections.LineCollection instance created to identify the quantile values of each of the violin’s distribution.
- vlines(x, ymin, ymax, colors=None, linestyles='solid', label='', *, data=None, **kwargs)[source]
Plot vertical lines at each x from ymin to ymax.
Parameters
- xfloat or array-like
x-indexes where to plot the lines.
- ymin, ymaxfloat or array-like
Respective beginning and end of each line. If scalars are provided, all lines will have the same length.
colors : list of colors, default: :rc:`lines.color`
linestyles : {‘solid’, ‘dashed’, ‘dashdot’, ‘dotted’}, optional
label : str, default: ‘’
Returns
~matplotlib.collections.LineCollection
Other Parameters
- dataindexable object, optional
If given, the following parameters also accept a string
s, which is interpreted asdata[s](unless this raises an exception):x, ymin, ymax, colors
**kwargs : ~matplotlib.collections.LineCollection properties.
See Also
hlines : horizontal lines axvline : vertical line across the Axes
- xaxis_date(tz=None)
Set up axis ticks and labels to treat data along the xaxis as dates.
Parameters
- tzstr or datetime.tzinfo, default: :rc:`timezone`
The timezone used to create date labels.
- xaxis_inverted()
Return whether the xaxis is oriented in the “inverse” direction.
The “normal” direction is increasing to the right for the x-axis and to the top for the y-axis; the “inverse” direction is increasing to the left for the x-axis and to the bottom for the y-axis.
- xcorr(x, y, normed=True, detrend=<function detrend_none>, usevlines=True, maxlags=10, *, data=None, **kwargs)[source]
Plot the cross correlation between x and y.
The correlation with lag k is defined as \(\sum_n x[n+k] \cdot y^*[n]\), where \(y^*\) is the complex conjugate of \(y\).
Parameters
x, y : array-like of length n
- detrendcallable, default: .mlab.detrend_none (no detrending)
A detrending function applied to x and y. It must have the signature
detrend(x: np.ndarray) -> np.ndarray
- normedbool, default: True
If
True, input vectors are normalised to unit length.- usevlinesbool, default: True
Determines the plot style.
If
True, vertical lines are plotted from 0 to the xcorr value using .Axes.vlines. Additionally, a horizontal line is plotted at y=0 using .Axes.axhline.If
False, markers are plotted at the xcorr values using .Axes.plot.- maxlagsint, default: 10
Number of lags to show. If None, will return all
2 * len(x) - 1lags.
Returns
- lagsarray (length
2*maxlags+1) The lag vector.
- carray (length
2*maxlags+1) The auto correlation vector.
- line.LineCollection or .Line2D
.Artist added to the Axes of the correlation:
.LineCollection if usevlines is True.
.Line2D if usevlines is False.
- b.Line2D or None
Horizontal line at 0 if usevlines is True None usevlines is False.
Other Parameters
- linestyle.Line2D property, optional
The linestyle for plotting the data points. Only used if usevlines is
False.- markerstr, default: ‘o’
The marker for plotting the data points. Only used if usevlines is
False.- dataindexable object, optional
If given, the following parameters also accept a string
s, which is interpreted asdata[s](unless this raises an exception):x, y
- **kwargs
Additional parameters are passed to .Axes.vlines and .Axes.axhline if usevlines is
True; otherwise they are passed to .Axes.plot.
Notes
The cross correlation is performed with numpy.correlate with
mode = "full".
- yaxis_date(tz=None)
Set up axis ticks and labels to treat data along the yaxis as dates.
Parameters
- tzstr or datetime.tzinfo, default: :rc:`timezone`
The timezone used to create date labels.
- yaxis_inverted()
Return whether the yaxis is oriented in the “inverse” direction.
The “normal” direction is increasing to the right for the x-axis and to the top for the y-axis; the “inverse” direction is increasing to the left for the x-axis and to the bottom for the y-axis.
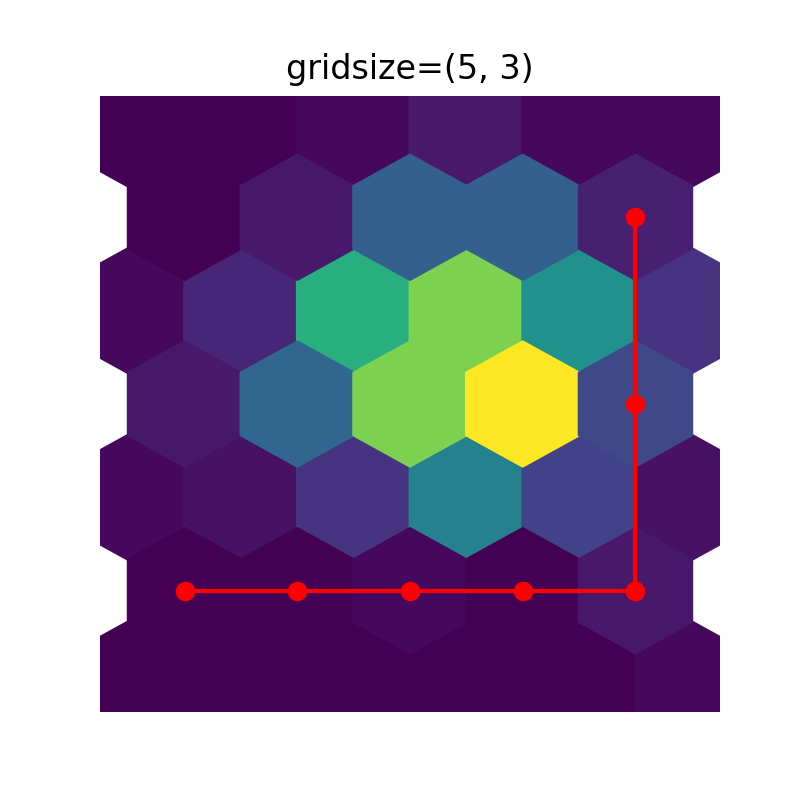
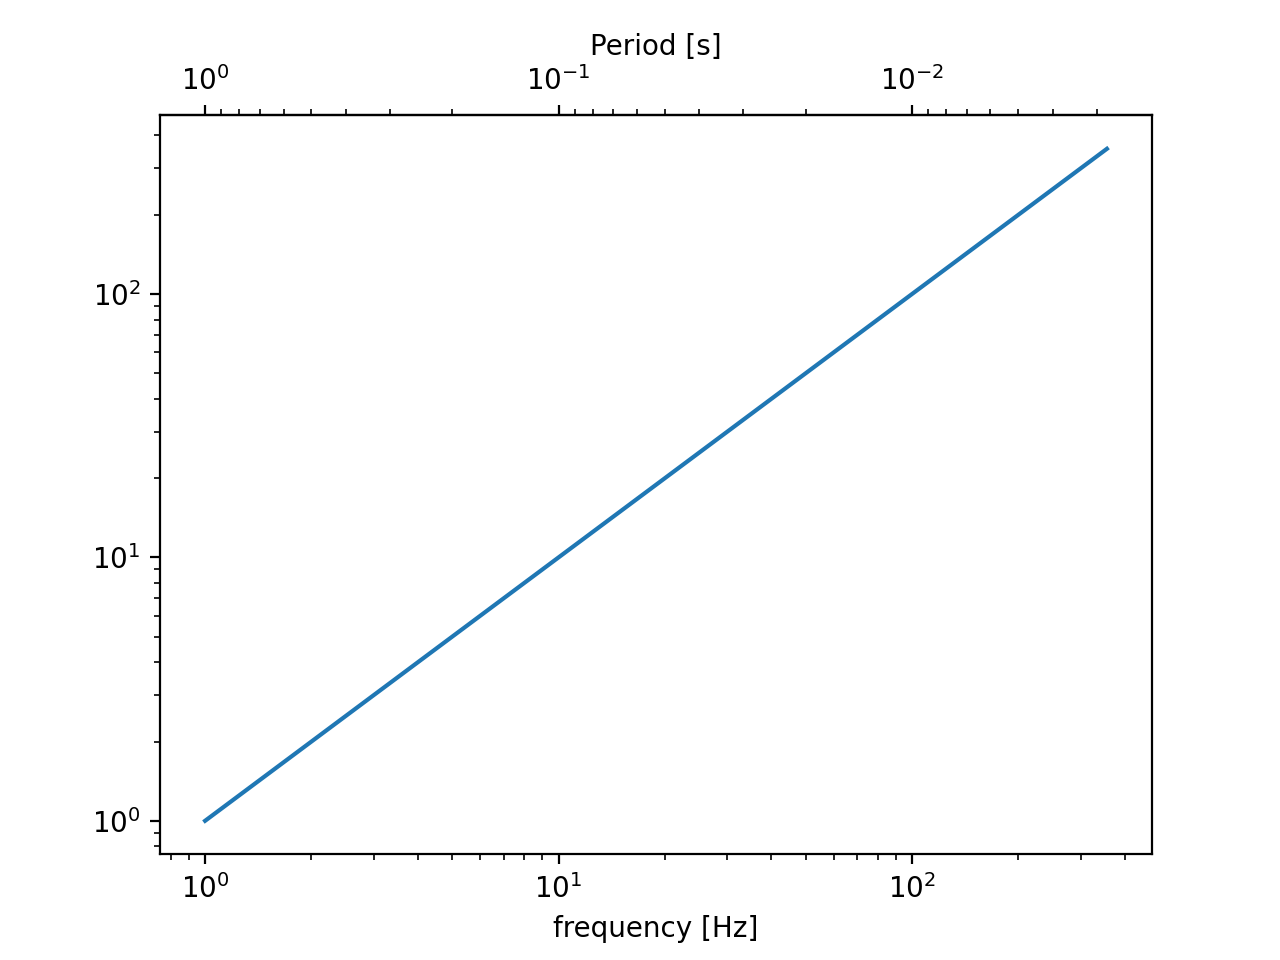
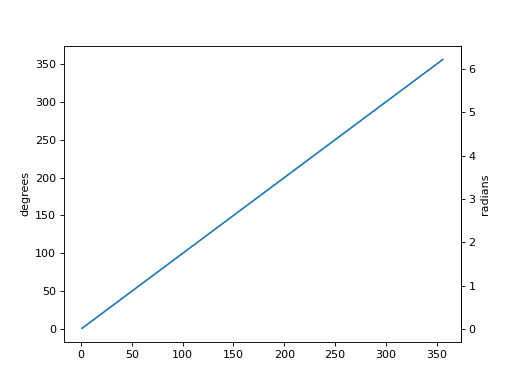
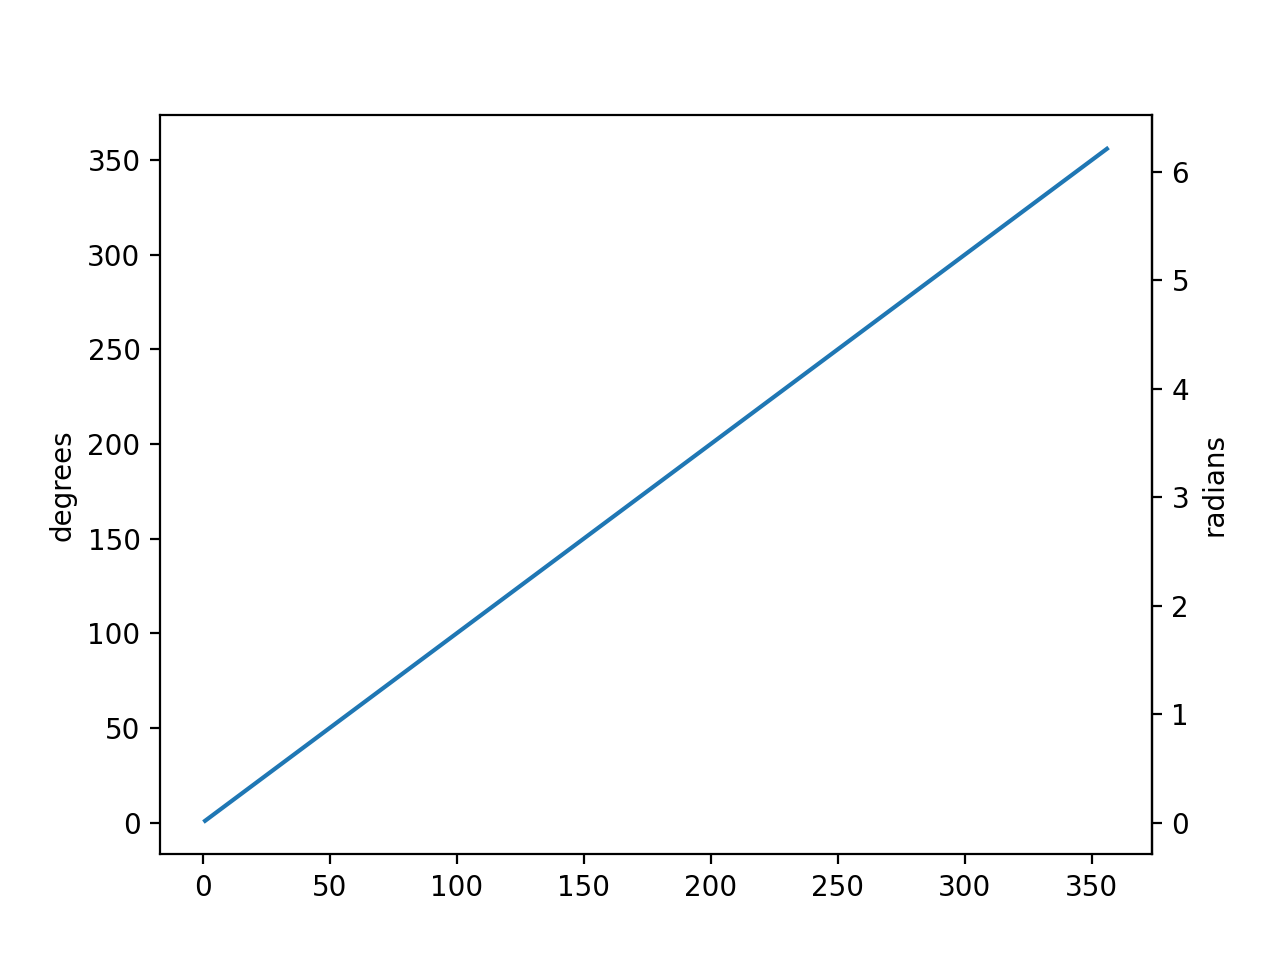