smpl.plot.ScalarFormatter
- class smpl.plot.ScalarFormatter(useOffset=None, useMathText=None, useLocale=None)[source]
Bases:
FormatterFormat tick values as a number.
Parameters
- useOffsetbool or float, default: :rc:`axes.formatter.useoffset`
Whether to use offset notation. See .set_useOffset.
- useMathTextbool, default: :rc:`axes.formatter.use_mathtext`
Whether to use fancy math formatting. See .set_useMathText.
- useLocalebool, default: :rc:`axes.formatter.use_locale`.
Whether to use locale settings for decimal sign and positive sign. See .set_useLocale.
Notes
In addition to the parameters above, the formatting of scientific vs. floating point representation can be configured via .set_scientific and .set_powerlimits).
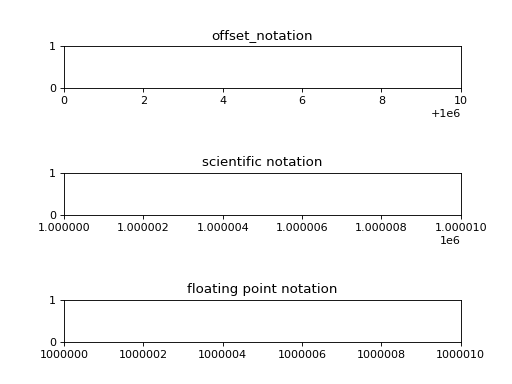
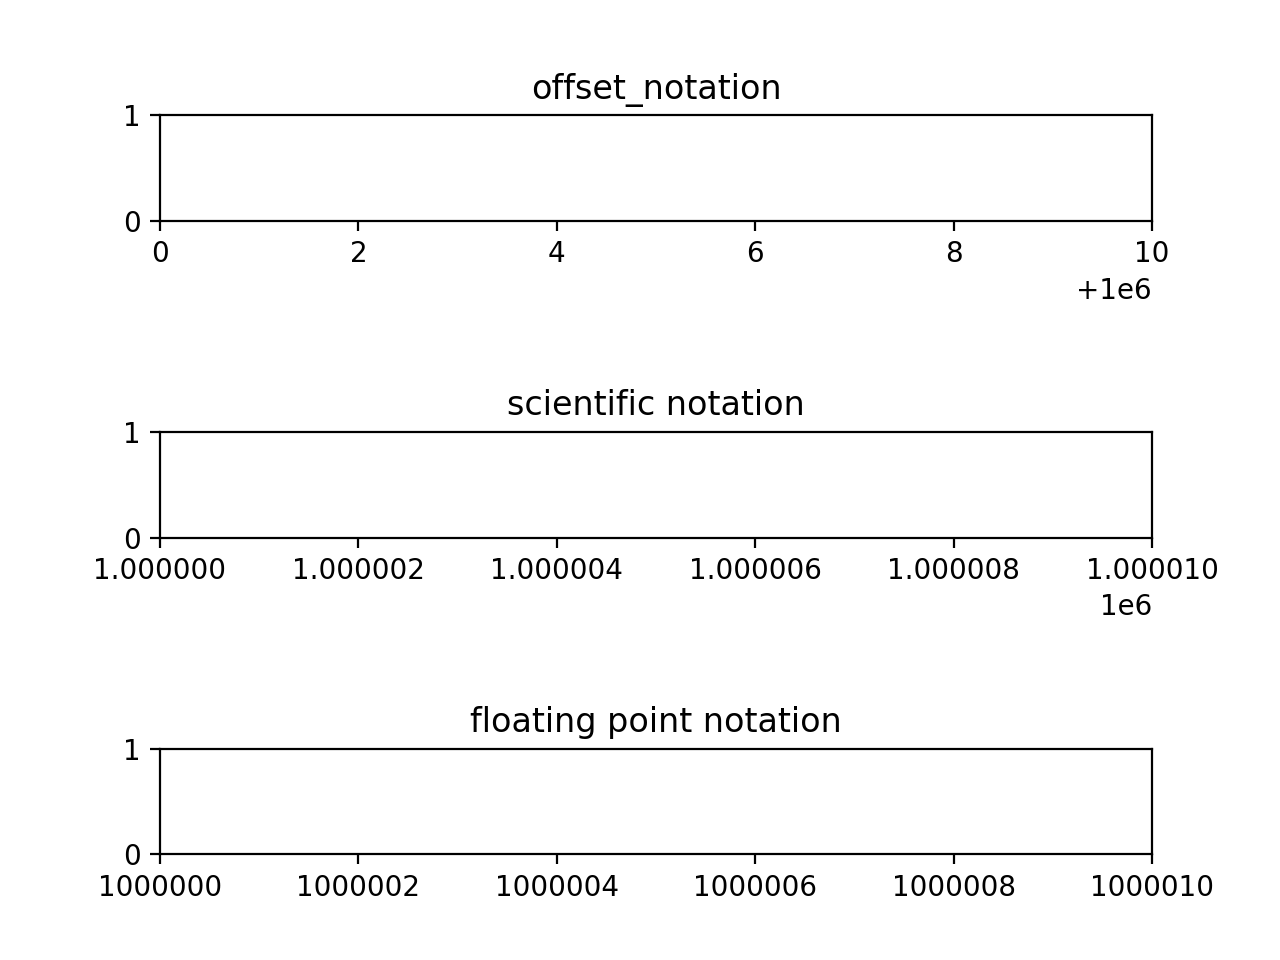
Offset notation and scientific notation
Offset notation and scientific notation look quite similar at first sight. Both split some information from the formatted tick values and display it at the end of the axis.
The scientific notation splits up the order of magnitude, i.e. a multiplicative scaling factor, e.g.
1e6.The offset notation separates an additive constant, e.g.
+1e6. The offset notation label is always prefixed with a+or-sign and is thus distinguishable from the order of magnitude label.
The following plot with x limits
1_000_000to1_000_010illustrates the different formatting. Note the labels at the right edge of the x axis.(Source code, png, hires.png, pdf)
Methods
__init__([useOffset, useMathText, useLocale])create_dummy_axis(**kwargs)fix_minus(s)Some classes may want to replace a hyphen for minus with the proper Unicode symbol (U+2212) for typographical correctness. This is a helper method to perform such a replacement when it is enabled via :rc:`axes.unicode_minus`.
format_data(value)Return the full string representation of the value with the position unspecified.
format_data_short(value)Return a short string version of the tick value.
format_ticks(values)Return the tick labels for all the ticks at once.
Return scientific notation, plus offset.
Return whether locale settings are used for formatting.
Return whether to use fancy math formatting.
Return whether automatic mode for offset notation is active.
set_axis(axis)set_bounds(vmin, vmax)[Deprecated]
set_data_interval(vmin, vmax)[Deprecated]
set_locs(locs)Set the locations of the ticks.
set_powerlimits(lims)Set size thresholds for scientific notation.
Turn scientific notation on or off.
set_useLocale(val)Set whether to use locale settings for decimal sign and positive sign.
set_useMathText(val)Set whether to use fancy math formatting.
set_useOffset(val)Set whether to use offset notation.
set_view_interval(vmin, vmax)[Deprecated]
Attributes
axislocsReturn whether locale settings are used for formatting.
Return whether to use fancy math formatting.
Return whether automatic mode for offset notation is active.
- static fix_minus(s)
Some classes may want to replace a hyphen for minus with the proper Unicode symbol (U+2212) for typographical correctness. This is a helper method to perform such a replacement when it is enabled via :rc:`axes.unicode_minus`.
- format_data(value)[source]
Return the full string representation of the value with the position unspecified.
- format_data_short(value)[source]
Return a short string version of the tick value.
Defaults to the position-independent long value.
- format_ticks(values)
Return the tick labels for all the ticks at once.
- get_useLocale()[source]
Return whether locale settings are used for formatting.
See Also
ScalarFormatter.set_useLocale
- get_useMathText()[source]
Return whether to use fancy math formatting.
See Also
ScalarFormatter.set_useMathText
- get_useOffset()[source]
Return whether automatic mode for offset notation is active.
This returns True if
set_useOffset(True); it returns False if an explicit offset was set, e.g.set_useOffset(1000).See Also
ScalarFormatter.set_useOffset
- set_bounds(vmin, vmax)
[Deprecated]
Notes
Deprecated since version 3.5: Use .Axis.set_view_interval and .Axis.set_data_interval instead.
- set_data_interval(vmin, vmax)
[Deprecated]
Notes
Deprecated since version 3.5: Use .Axis.set_data_interval instead.
- set_locs(locs)[source]
Set the locations of the ticks.
This method is called before computing the tick labels because some formatters need to know all tick locations to do so.
- set_powerlimits(lims)[source]
Set size thresholds for scientific notation.
Parameters
- lims(int, int)
A tuple (min_exp, max_exp) containing the powers of 10 that determine the switchover threshold. For a number representable as \(a \times 10^\mathrm{exp}\) with \(1 <= |a| < 10\), scientific notation will be used if
exp <= min_exporexp >= max_exp.The default limits are controlled by :rc:`axes.formatter.limits`.
In particular numbers with exp equal to the thresholds are written in scientific notation.
Typically, min_exp will be negative and max_exp will be positive.
For example,
formatter.set_powerlimits((-3, 4))will provide the following formatting: \(1 \times 10^{-3}, 9.9 \times 10^{-3}, 0.01,\) \(9999, 1 \times 10^4\).
See Also
ScalarFormatter.set_scientific
- set_scientific(b)[source]
Turn scientific notation on or off.
See Also
ScalarFormatter.set_powerlimits
- set_useLocale(val)[source]
Set whether to use locale settings for decimal sign and positive sign.
Parameters
- valbool or None
None resets to :rc:`axes.formatter.use_locale`.
- set_useMathText(val)[source]
Set whether to use fancy math formatting.
If active, scientific notation is formatted as \(1.2 \times 10^3\).
Parameters
- valbool or None
None resets to :rc:`axes.formatter.use_mathtext`.
- set_useOffset(val)[source]
Set whether to use offset notation.
When formatting a set numbers whose value is large compared to their range, the formatter can separate an additive constant. This can shorten the formatted numbers so that they are less likely to overlap when drawn on an axis.
Parameters
- valbool or float
If False, do not use offset notation.
If True (=automatic mode), use offset notation if it can make the residual numbers significantly shorter. The exact behavior is controlled by :rc:`axes.formatter.offset_threshold`.
If a number, force an offset of the given value.
Examples
With active offset notation, the values
100_000, 100_002, 100_004, 100_006, 100_008will be formatted as
0, 2, 4, 6, 8plus an offset+1e5, which is written to the edge of the axis.
- set_view_interval(vmin, vmax)
[Deprecated]
Notes
Deprecated since version 3.5: Use .Axis.set_view_interval instead.
- property useLocale
Return whether locale settings are used for formatting.
See Also
ScalarFormatter.set_useLocale